A few days ago I made a post where I compared sklearn’s LogisticRegression() function with statsmodels’ Logit() function. During this comparison I was quite surprised to discover that statsmodels’ Logit() scored 3% better accuracy than sklearn’s LogisticRegresion(). When I investigated this, I learned that sklearn’s parameters are tighter than statsmodels and this is the reason for the better accuracy. The documentation stated that I could set sklearn’s LogisticRegression() C parameter to a high number, such as 100, and penalty to ‘none’, but when I tried this the accuracy did not improve. Therefore, even when I loosened the parameters of sklearn’s LogisticRegression(), its accuracy still did not improve and as a consequence did not perform as well as statsmodels’ Logit(). The link to this post can be found here:- A comparison of sklearn and statsmodel’s logistic regression function | by Tracyrenee | AI In Plain English | Dec, 2020 | Medium
Sklearn’s LogisticRegression() not only is able to make predictions on binary labels, but can also predict on multilabel datasets just by setting the parameter multiclass to ‘multinomial’. What I discovered, however, is that Statsmodels has no such parameter setting. Instead, when making predictions the function MNLogit must be used to carry out the computation.
I decided it would be prudent to compare sklearn to statsmodels using a multiclass dataset and decided to use the class imbalanced E.Coli data set to test on. I wanted to see how statsmodels’ NMLogit() responds to such an extreme class imbalance. The E.Coli dataset can be found at this link:- https://raw.githubusercontent.com/jbrownlee/Datasets/master/ecoli.csv
The imbalanced dataset describes the problem of classifying E.coli proteins using their amino acid sequences in their cell localization sites. That is, predicting how a protein will bind to a cell based on the chemical composition of the protein before it is folded.
The dataset is credited to Kenta Nakai and was developed into its current form by Paul Horton and Kenta Nakai in their 1996 paper titled “A Probabilistic Classification System For Predicting The Cellular Localization Sites Of Proteins.” In it, they achieved a classification accuracy of 81%.
The dataset is comprised of 335 examples of E.coli proteins and each example is described using seven input variables calculated from the proteins amino acid sequence to form eight classes.”
I created a Python program using Google Colab because it is a free online Jupyter Notebook that has many libraries already preinstalled on it. It is easy to use and the good thing about it is the fact I can call the Python program up from any computer I am working on that can access Google Colab.
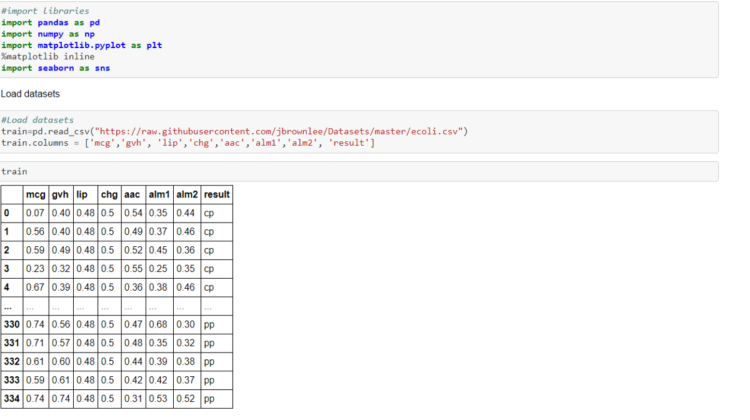
Once I created the Python file, I imported some of the libraries I would need, such as pandas, numpy, matplotlib and seaborn.
I then loaded and read the E.coli dataset into the program. The dataset did not have any column names, so I had to define the column names, otherwise the first row of the dataset would become the column names:-
I then checked for any null values and on this occasion there were not any null values that needed to be imputed:-
Because the labels were strings, I had to label encode them using sklearn’s LabelEncoder():-
I wanted to know how many examples I had of each class to work with, so I put the labels on a counter. When I counted how many examples of each class, I realised this is an extremely imbalanced dataset and is therefore very difficult to work with:-
I plotted a graph of the target variable and was given a visual representation of the class imbalance I needed to make predictions on:-
I defined the X and y variables, which will be used to split the data into training and validation sets. The target is y and is composed of train.result. X is composed of the dataset with train.result dropped.
I then used sklearn’s train_test_split() to break the dataset down into training and validation datasets. I set the test size to 50% in the hope every class would be represented in the validation process.
I scaled the data down to an appropriate level using sklearn’s StandardsScaler() function.
I decided to put y_val on a counter and was pleased to see that all eight classes swerve represented in the array:-
I then set the class weights, which would be used to address the class imbalance during the modelling process.
I plotted y_val in a graph so the class imbalance of the array was very apparent:-
I selected sklearn’s LogisticRegression() and when it was trained and fitted I achieved an accuracy of 89.82%
When I made predictions on the validation set I achieved an accuracy of 76.79%. When I put the prediction on a counter and confusion matrix I could see that Class 2 was not represented in the model:-
The next model I tested on was statsmodels’ MNLogit() but I was unable to obtain a score for training and fitting the model:-
When I predicted on the validation set I achieved an accuracy of 80.36%. When I plotted the prediction I could see that two of the classes had not been represented:-
When I put the prediction on a counter and a confusion matrix i Could see that Class 2 ans Class £ were unrepresented. I investigated this and found that statsmodels Logit() and MNLogit() do not set parameters to balance weights. Therefore, for the time being anyway, statsmodels is not a suitable library to predict on highly imbalanced datasets.
The code for this program can be found in its entirety in my personal GitHub account, with the link being found here:- Misc-Predictions/E_Coli_sklearn_&_statsmodels.ipynb at main · TracyRenee61/Misc-Predictions (github.com)