I have not posted on COV19 in the past few days because I want to discuss a variety of data science subjects. It has recently come to light, however, that the US has developed a mutation of the original virus, which is coming out of California. In addition, it has been realised that the mutation of COV19 is much more infectious and dangerous than the virus in its original form. It is for that reason I felt it necessary to revisit the original comparison between the statistics of both the US mutation and the UK mutation of the virus.
According to Boris Johnson, for every 10 deaths per thousand of the original COV19, being .01%, the mortality rate for the UK variant has increased to 13 or 14 deaths per thousand, which is an increase to .014%. It is because the UK mutation of COV19 has become more dangerous that it is worth taking another look at this virus from a data scientist’s perspective.
The program I have written to analyse the coronavirus is in Python, using Google Colab, and saved on a GitHub repository. Sometimes the program will not load on GotHub, so I view it on nbViewer.jupyter.org, which I have done for this post.
I have discussed the original program in previous posts, so I will cut to the chase and only analyse the parts of the program that rate to the UK and the US.
I used a filter to select the UK statistics and I have to say that I am disappointed that many of the columns of data, such as those relating to hospital stays, have been left blank. If the UK provided more information about their hospitals then I could carry out a more thorough analysis:-
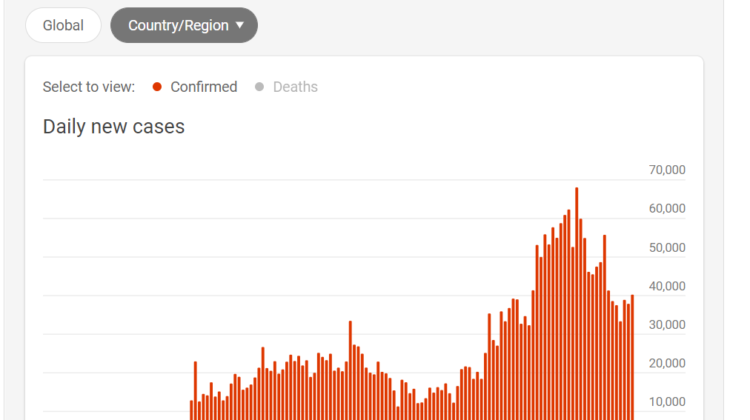
The graph I plotted of the UK’s new cases per million shows quite clearly the UK is in the third and harshest stage of the progression of the virus. The UK strain of COV19 was first noted in December 2020 and it is clear from the graph that this strain is much more contagious than the original version because the number of new cases per million has really increased:-
I ran a chart of new deaths per million in the UK and the deaths have really increased since December. This reveals that not only is the UK strain more contagious, it is also more deadly:-
I then used a filter to create a dataframe of the US COV19 statistics and was disappointed to see that the US does not include information on hospital admissions, etcetera. Therefore I was unable to obtain any statistical information concerning the hospitals, which would have been nice:-
When I ran a chart of the US’s new cases per million, I could see that the new cases have really spiked. This surge in new cases is partly due to the fact that the highly contagious UK variant has made it across the pond to the US and partly because of the new strain coming out of California:-
When I ran the chart of new deaths per million of the US cases and found that the deaths are increasing as well:-
Once I had filtered out the US and the UK to create graphs to compare all of the countries that now have mutations of COV19.
The UK is represented by the amber line and its new cases per million present the highest peak, although the new cases are decreasing and the UK government has stated that the R number is decreasing as well. The R number is a key factor in gauging the coronavirus pandemic. It refers to the ‘effective reproduction number’ of COVID-19. An R value of 1 is a crucial threshold. As at 22 January 2021, the R number is 0.8 to 1.0, which means that every 10 people infected with the virus will go on to infect 8 to 10 other people. The UK new deaths per million represent the highest peak of any of the countries that have mutations, and this is due to the increased infectiousness and deadliness of the UK strain of COV19.
The US is represented by the green line and its new cases per million are comparable to the UK’s. This is in all likelihood due to the mutations of other strains making it to their borders. The US’s new deaths per million are less than the UK’s, but this metric is definitely on the increase and needs to be addressed.
In summary, the mutations of COV19 have caused the virus to become more contagious and dangerous, which is something the UK and US government are endeavouring to correct through their lockdown procedures and vaccination program.
The code for this post can be found in its entirety in my personal GitHub account, the link is here:- COV19/COV19_Compare_UK_&_US.ipynb at main · TracyRenee61/COV19 (github.com)