Autoencoders are unsupervised neural network models that are used to learn to represent the data with fewer parameters. Data compression algorithms have been known for a long time however, learning the nonlinear operations in order to map the data into lower dimensions has been the contribution of autoencoders into the literature.
Introduction
Autoencoders provided a very basic approach to extract the most important features of data by removing the redundancy in data. Redundancy occurs when multiple pieces (columns in a .csv file or a pixel location in an image dataset) of a dataset shows a high correlation among themselves. In such cases, just holding one of the columns or disregarding the correlated pixels except one would allow us to store the same data with acceptable information loss.
In the scope of image compression, one of the most popular techniques was the JPEG algorithm which employs discrete cosine transformation[2] and a linear transformation that yields an image matrix that is mostly occupied by zeros after a simple integer rounding. Simply, holding only the non-zero elements and ignoring the rest would create a representation of the data with fewer parameters. Applying the inverse of the transformations would reconstruct the same image with little losses.
A mathematical intuition lies underneath the idea of utilizing discrete cosine transformation and applying a certain linear transformation, however we cannot make sure that this is the best mapping there is. JPEG is a good algorithm that is still commonly used today but what if we come up with a model that learns a better mapping specific to the relevant data. Autoencoders exactly does it by compressing and reconstructing the data by learned parameters. The loss is defined as reconstruction loss in terms of the input data and reconstructed data which is usually L1 or L2 losses.
The idea of denoising the data with autoencoders has been proposed by Gallinari & LeCun et al. in 1987[4] which has been an alternative to the Hoplied network which utilizes associative memory for the task[5]. Today, autoencoders are widely used not only for denoising and compression but also for data generation.
A Simple AutoEncoder with Tensorflow
Actually, autoencoders are not novel neural networks, meaning that they do not have an architecture with unique properties for themselves. Instead, an autoencoder structure is a pipeline that uses other types of modules (fully connected layers, convolutional layers, copying, cropping, etc.) in connection. The complexity of the models is flexible regarding the nature of the data and the task. In this article, a straightforward autoencoder with fully connected layers will be built and tested on the MNIST dataset.
For a simple implementation, Keras API on TensorFlow backend is preferred with Google Colab GPU services.
First, needed libraries are imported.
import tensorflow as tf
import numpy as np
import matplotlib.pyplot as plt
from tensorflow.keras import datasets, layers, models, losses, Modelfrom random import randint
The Data
MNIST data is available on Keras and it is imported with one line of code within seconds. Since the purpose of the model will be learning how to reconstruct the data, it is an unsupervised task or with a better term, I enjoy it is self-supervised. Thus, labels are not necessary and not stored while loading the data.
The train set has 60000and the test set has 10000 mono-channel images with 28×28 sizes. The test set will be used for validation during training.
(x_train, _), (x_test, _)=tf.keras.datasets.mnist.load_data()
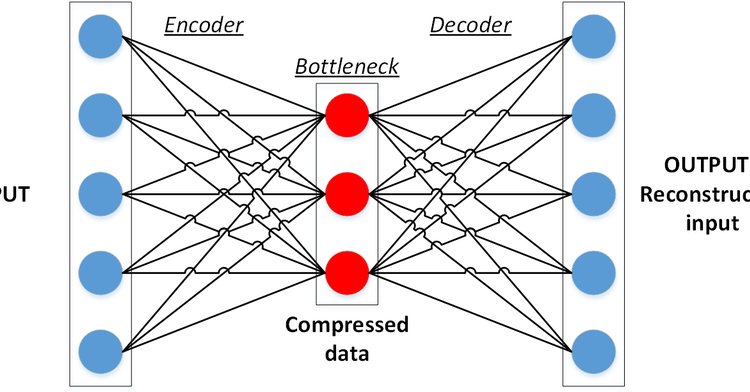
The Encoder
First, the images will be flattened into a vector having 28 x 28 = 784 elements. And then, after passing a hidden layer with 100 neurons, the output of the encoder will have 20 parameters. This is named the latent representation of the data. If the model gets successfully trained, it will be able to represent the MNIST images with only 20 numbers.
hidden_size = 100
latent_size = 20input_layer = layers.Input(shape = x_train.shape[1:])flattened = layers.Flatten()(input_layer)
hidden = layers.Dense(hidden_size, activation = 'relu')(flattened)
latent = layers.Dense(latent_size, activation = 'relu')(hidden)
encoder = Model(inputs = input_layer, outputs = latent, name = 'encoder')encoder.summary()
The hidden size does not have to be included, however heuristically adding a few layers increase the representation power of the encoder. ReLU activation is chosen for the fully connected layers.
Model: "encoder" _________________________________________________________________ Layer (type) Output Shape Param # ================================================================= input_1 (InputLayer) [(None, 28, 28)] 0 _________________________________________________________________ flatten (Flatten) (None, 784) 0 _________________________________________________________________ dense (Dense) (None, 100) 78500 _________________________________________________________________ dense_1 (Dense) (None, 20) 2020 ================================================================= Total params: 80,520 Trainable params: 80,520 Non-trainable params: 0
The Decoder
The decoder aims to undo what the encoder did by reverse operations. Meaning, latent variables will be upsampled to 100 and 784 respectively. Finally, the vector will be reshaped into an image matrix.
input_layer_decoder = layers.Input(shape = encoder.output.shape)
upsampled = layers.Dense(hidden_size, activation = 'relu')(input_layer_decoder)
upsampled = layers.Dense(encoder.layers[1].output_shape[-1], activation = 'relu')(upsampled)
constructed = layers.Reshape(x_train.shape[1:])(upsampled)decoder = Model(inputs = input_layer_decoder, outputs = constructed, name= 'decoder')decoder.summary()
Notice that the input size of the decoder is equal to the output size of the encoder. Similarly, the output size of the final layer is equal to the size of the output of the encoder’s first layer. Above you can see that it is “None, 784”.
Model: "decoder" _________________________________________________________________ Layer (type) Output Shape Param # ================================================================= input_2 (InputLayer) [(None, None, 20)] 0 _________________________________________________________________ dense_2 (Dense) (None, None, 100) 2100 _________________________________________________________________ dense_3 (Dense) (None, None, 784) 79184 _________________________________________________________________ reshape (Reshape) (None, 28, 28) 0 ================================================================= Total params: 81,284 Trainable params: 81,284 Non-trainable params: 0
The Autoencoder
The computational graph of the model is structured such that the overall input is the input of the encoder, and the overall output is the output of the decoder as it processes the output of the encoder.
autoencoder = Model(inputs = encoder.input, outputs = decoder(encoder.output))
autoencoder.summary()Layer (type)                 Output Shape              Param #    ================================================================= input_1 (InputLayer)         [(None, 28, 28)]          0          _________________________________________________________________ flatten (Flatten)            (None, 784)               0          _________________________________________________________________ dense (Dense)                (None, 100)               78500      _________________________________________________________________ dense_1 (Dense)              (None, 20)                2020       _________________________________________________________________ decoder (Functional)         (None, 28, 28)            81284      ================================================================= Total params: 161,804 Trainable params: 161,804 Non-trainable params: 0
The loss is the mean squared error between the input image and the reconstructed image, namely L2 loss. The model is trained for 50 epochs with batches of 64 samples.
autoencoder.compile(optimizer='adam', loss=losses.MeanSquaredError())history = autoencoder.fit(x_train, x_train, epochs=50, batch_size=64, validation_data = (x_test, x_test))Epoch 1/50 938/938 [==============================] - 3s 2ms/step - loss: 3085.7667 - val_loss: 1981.6154
Epoch 2/50 938/938 [==============================] - 2s 2ms/step - loss: 1917.1781 - val_loss: 1790.9906
...
Epoch 50/50 938/938 [==============================] - 2s 2ms/step - loss: 1456.5116 - val_loss: 1454.8712
Since this is not a classification example there is not metric as accuracy and the important metrics to be tracked are the losses. Even though 1456 might seem a big number the drop in the error compared to the initial epochs implies a learning phase. Moreover, the loss is not an absolute metric like the accuracy of the F1-score, it should be commented on according to the context.
fig, axs = plt.subplots(figsize=(15,15))
axs.plot(history.history['loss'])
axs.plot(history.history['val_loss'])
axs.title.set_text('Training Loss vs Validation Loss')
axs.set_xlabel('Epochs')
axs.set_ylabel('Loss')
axs.legend(['Train','Val'])
In this article qualitative analysis (eye-test) would be more informative about the success of the model rather than quantitative analysis. First, some random reconstructions are visualized:
fig, axs = plt.subplots(3,2,figsize=(10,15))
for i in range(3):
sample1 = x_train[randint(0,x_train.shape[0])]
axs[i][0].imshow(sample1, cmap = 'gray')
axs[i][1].imshow(autoencoder(np.expand_dims(sample1,0))[0], cmap = 'gray')
As you can see, some information loss occurred since it is a very basic autoencoder, however it is still possible to understand which digit is subjected to the model in most cases.
A more interesting visualization idea is playing on the latent space and observing the results. Each image is first encoded into vectors with a size of 20. What happens if we take the average of these two latent vectors and pass it to the decoder? Would the reconstructed image resemble both original digits or would something completely meaningless image appear? Further, we can take the weighted averages of the latent variables and visualize the effects of gradual change in the latent vector:
sample1_idx = randint(0,x_train.shape[0])
sample1 = x_train[sample1_idx]sample2_idx = randint(0,x_train.shape[0])
sample2 = x_train[sample2_idx]latent1 = encoder(np.expand_dims(sample1,0))
latent2 = encoder(np.expand_dims(sample2,0))weights = np.arange(0.05,0.95,0.15)fig, axs = plt.subplots(2,4,figsize=(20,10))
axs = axs.ravel()axs[0].imshow(sample2, cmap = 'gray')
axs[-1].imshow(sample1, cmap = 'gray')for i in range(6):
latent = latent1*weights[i] + latent2*(1-weights[i])
constructed = decoder(latent)
axs[i+1].imshow(constructed[0], cmap='gray')
In the image above we changed to weighted importance of the two latent vectors from 95%-5% to 5%-95%. Accordingly, the reconstructed image first resembled “0”. When it comes to 50%-50% it becomes completely unrecognizable, it is neither “0” nor “1”. Finally, as the importance of the second latent vector becomes dominant, the decoder produces images that look like “1”.
autoencoder_tensorflow.ipynb
Conclusion
Autoencoders create an alternative way to compress the data by learning efficient data-specific mappings and reducing the dimensionality. In this article, MNIST, images consisting of 784 pixels have been represented by a vector having a size of 20 and reconstructed back. Even though the results were not perfect it was still possible to see that the latent vector holds a good majority of information while losing the details. The embedded information in the latent variable decides the success of the reconstruction. By manipulating the latent vector, it is possible to create intermediate results.
Hope you enjoyed it. See you in the following AutoEncoder applications.
Best wishes…
mrgrhn
References
- Sublime, Jeremie & Kalinicheva, Ekaterina. (2019). “Automatic Post-Disaster Damage Mapping Using Deep-Learning Techniques for Change Detection: Case Study of the Tohoku Tsunami”. Remote Sensing. 11. 1123. 10.3390/rs11091123.
- NN, Ahmed & Natarajan, T. & Rao, Kamisetty. (1974). “Discrete Cosine Transform”. Computers, IEEE Transactions on. C-23. 90–93. 10.1109/T-C.1974.223784.
- Ri, S. & Tsuda, H. & Chang, K. & Hsu, S. & Lo, F. & Lee, T.. (2020). “Dynamic Deformation Measurement by the Sampling Moiré Method from Video Recording and its Application to Bridge Engineering”. Experimental Techniques. 44. 10.1007/s40799–019–00358–4.
- Gallinari, P., LeCun, Y., Thiria, S., & Fogelman-Soulie, F. (1987). “Memoires associatives distribuees”. Proceedings of COGNITIVA 87. Paris, La Villette.
- https://citeseerx.ist.psu.edu/viewdoc/download?doi=10.1.1.536.3644&rep=rep1&type=pdf