Separability
Financial world is driven by so many factors and every entity is projected in terms of many features like a portfolio of a loan seeker, balance sheet of companies, etc. In this versatile environment there are different kinds of events happening. When explainers try to explain such events we expect that two entirely different scenarios should be far enough in N-dimensional space and their explanations should also differ sufficiently so that they fall in different explanation clusters.
This ensures separability amongst the explanations!
Similarity
Usually we follow the Elbow method to determine the number of cluster to be formed while applying k-means to input dataset. This value usually comes in single digits which is really good in generic scenarios. In financial world, there can be lot many types of events which ideally should be clustered differently if we look into N-dimensional space at a local level but if we follow our approach we tend to consider events on a global level for clustering.
This deviates from our goal but we cannot come up to a good hyper parameter for such datasets. This is the motivation behind Similarity metric. This gives a rough idea that in one cluster if we pick two random points we expect them to be similar. This gives us a confidence of data similarity in input data clusters. Ideally all data points belonging to same cluster should be similar but this is not always the case given complexity of data. So by this metric we get some idea about the data distribution in clusters.
We compare samples with a simple cosine similarity method. We expect cosine similarity of points belonging to different clusters to be around 0.
For Similarity we, calculate the mean of all 100 randomly picked distinct pair of data points (stored in list) belonging to same cluster.
We also calculate the standard deviation of this list which tells us about their distribution.
Simulatability
I was exploring state of the art techniques for evaluating explanations given by our explainers which gives us a better understanding of their versatility in explaining different models. I read this paper which has an interesting approach in measuring effect on human interpretability and it’s deviation when human subjects are acknowledged with explanations. Herein human subjects were hired and trained to perform certain tasks and based on their interpretations and effect of explanations on their interpretations.
We will be discussing about the experiments performed in this paper (these were done for text data as it is easy for humans to interpret text) in short and the basis of which we come up with a new methodology to evaluate explanations without human subject involvement.
This paper has performed model explanation based on some explainers two of which are common with ours namely LIME and Anchor. Firstly we define model simulatability as property of model which ensures human subject can predict model output given new set of inputs as LIME and Anchor perform locally in the features space, it is easy for human test subjects to judge model output compared to that of EBM and Shap. We will discuss two type of tests namely Forward Simulatability and Counterfactual Simulatability. Our metric calculates explanation effect on human interpretation
metric = (POST simulatability accuracy — PRE Simulatability accuracy)
Forward Simulatability
PRE phase
Human subjects are given data from validation set, the model prediction and the data labels. They are asked to predict the model output. This is a PRE phase whose accuracy is calculated by comparing human subject output prediction with actual model output.
POST phase
Human subjects are given data, model output, data labels and explanations based on which they are asked to predict model output on the same dataset given to them in PRE phase. Thus the change in predicted outputs of human subjects is purely the effect of explanations.
Counterfactual Simulatability
The motivation for this test is to observe change in human evaluation on a perturbation of a data point.
PRE phase
Humans are trained on the training data and corresponding model output of training data. Now they are given data, model output and data labels in test data and are asked to predict model output on a perturbed data (here we follow a specific perturbation) which is basically artificial data generated which acts in opposite sense of the data provided to the user initially. Here we get to know human subject’s predictions on the data points which are artificially acting opposite to the data points which they were given initially.
POST phase
Humans are given data from test set, model output, data labels and explanations. Now they are asked to predict model output on perturbed data.
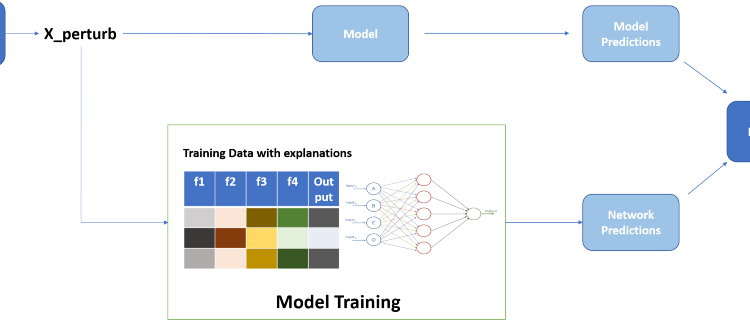
The main idea is to ‘strategically’ train a neural network instead of human subjects on dataset and different explanation weights.
Main Advantages:
1. Removal of dependency on human interpretations
2. Applicable on highly complex black box models
3. Dataset size is never a concern
Inclusion of explanation weights in input data
For POST metric we have to come up with some plan to include explanation weights in corresponding dataset. These can be either embedded or attached in some form which enhances explanation effect and simulates a human interpretation and effects of explanations.
So we do both!
- Embedding explanation weights
Represents fusion of data features and explanation feature weights at individual level as both are expected to represent similar scenarios. Neural network will train on this embedded data and capture effect of explanations. As explanations are just weights of features we simply have to individually multiply it with data.
- Appending explanation weights
This just expects neural network to learn explanation effects by just a simple append. Thus the number of features will be twice for neural network to learn. This replicates a naive human who just has extra explanation data without understanding its significance to input data.
Since these are two different approaches, our number of experiments will also get doubled. For simplicity we will be referring to this generated training_data in POST methods.
Optimized and enhanced Forward Simulatability
- Train neural network on input data by providing model output and labels
- Predict model output on validation data
- Calculate model accuracy => PRE_forward