From this set of data, we plotted a best-fit line to demonstrate a linear relationship…great, but how did we know that this is the best line we could have drawn? Well, this sacred knowledge is the result of an important combination of symbols and numbers called the Cost Function or the Mean Squared Error Function.
No, I did not fall asleep on my keyboard, these are actual equations — but don’t worry because they are actually much simpler than they appear to be! Here we see that the equation takes in two parameters (θ₀,θ₁). This function then takes summation, starting from the first data point(i = 1) to the last data point(m), of the square of the subtraction between the predicted y-value(hᶿ(𝒙^(i))) and the actual y-coordinate of a data points(y^(i)). Put simply, take the sum of all the squared values of the error in each data point and multiply it by the inverse of double the amount of data points. This answer is then multiplied by the inverse of double the number of data points. Alright…but what is the hᶿ function actually doing? Let’s introduce exactly what its all about:
These two functions are the same — they just use different notation. Hopefully, you can start to see some patterns (θ₁ = m, θ₀ = b, hᶿ(𝒙) = y). Although there are some minor differences, those technicalities aren’t necessary to continue.
Now that we have some equations written down, we can start understanding what they do and how we can use this information to help us. The point of the cost function is to find the verticle distance between each point and the line-of-best-fit.
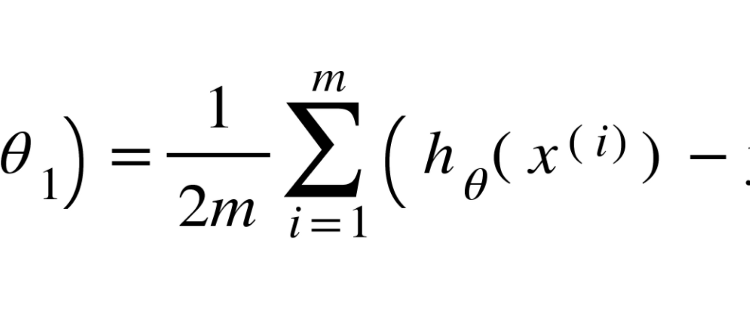
To fully grasp the concept, instead of using two parameters, we will only use one parameter. We will now adjust our equations:
Alright, the concept is pretty straightforward from here. Once you actually start working with the numbers, you get an amazing insight — let’s try it!
If you’ve done the math right, you should get something like this:
So now we know that for this particular set of data, a slope of 0.5 is not a great fit. However, if you had a line with a slope of 1, the cost function would equal 0 because you would be dead on!
Awesome! Now we know how to use the cost function, but let’s try to understand how machines would predict a best-fit line to be as accurate as possible with the data.
Let’s start by plotting the Cost Function vs. Parameter value graph with θ₁ on the x-axis and J(θ₁) on the y-axis. We should see something similar to this:
We can definitively see that our slope of 0.5 was definitely not close to our data, but we can also see our goal — the slope of 1. Now, why does this graph make any sense? Well, the cost function is plotted on the y-axis, and for a line-of-best-fit to be accurate we need the cost function, or y-coordinate, to be 0. The point (1,0) has the desired y-coordinate, therefore, we know that the slope, or x-coordinate, needs to be 1 to get the cost function’s output of 0. The (1,0) point is also known as the minimum of our function (cause it has the smallest y-coordinate, duh!).
Neat! We now know how to apply the cost function to a set of data points and how to estimate the minimum of the parabolic graph to get our desired slope, now what?
Since you have a decent understanding of linear regression with one parameter, we can revert to the original function with two parameters. It’s not hard to understand, but there are some more details to cover. But first, want to see a really cool image? Sure you do, here:
This is a contour plot! Essentially it is a 3-dimensional graph but we have used it to display both parameters as well as the cost function. Now, you may be wondering what the stars and circles are all about…it’s actually pretty interesting. Depending on where you start on this contour plot, using an algorithm that I will discuss shortly, the machine will find the local minimum of the function. However, you may not know if the minimum you’ve reached is the local minimum or the global minimum. The difference between the two is that the first is the lowest point nearest to where you’ve started while the latter is the lowest throughout the entire function. However, linear regression will usually be the dome shape below:
Luckily, the contour plot is color-coded so that we can identify elevation — colors close to red are at higher elevations while colors close to blue are at lower elevations. In the same way that we wanted the y-coordinate to be 0 in the parabolic function, we want to find the set of parameters that allow us to be in the center of this contour plot, also the most blueish area, because that is the lowest point. From before, we know that the lowest point correlates to the lowest error value(the output of the cost function).
So we have this contour plot, but how does this relate to the cost function? By selecting certain areas on a graph with the two parameters one either axis as well as colors representing certain heights, we get an accurate picture of how accurate the two parameters are:
The graph on the right side should look familiar — it is essentially the contour plot except the dimension showing the error which is replaced by different colors(blueish = low error, reddish = high error). From the red “x”, we can see what line is being passed through the data. Although we’re close to the most blueish part of the right graph, we can see that our best-fit line is still quite inaccurate. Watch what happens when we go to the blueish center of the right graph:
Awesome! We’re at the most blueish part of the right graph — an indication of the lowest error of our best-fit line — we can see that our line-of-best-fit on the left graph is decently accurate to the data points. Now let’s explore exactly how the values of the parameters are tuned, or updated, to find the lowest error points in a contour plot. Well, let me introduced another intimidating but simple formula:
Awesome! We’re at the most blueish part of the right graph — an indication of the lowest error of our best-fit line — we can see that our line-of-best-fit on the left graph is decently accurate to the data points. Now let’s explore exactly how the values of the parameters are tuned, or updated, to find the lowest error points in a contour plot. Well, let me introduced another intimidating but simple formula:
Alright…that’s really unnerving. Yeah, ok, I get it — but it will make sense. So, what’s the logic behind this equation? Well, from our starting point, we want to gradually get closer to the minimum of our function and continuously update our two parameters until we reach the lowest point (also called convergence).
Now let’s get some things out of the way. The “:=” merely refers to the assignment — assigning a variable some value. The “⍺”, the Greek letter alpha, is the learning rate — how gradual our path to convergence (getting the lowest point of the cost function) will be. For you to understand the “(∂/∂θ₁)(J(θ₁,θ₀))” at a high level, we’ll need to revert to one parameter. Take a look at the parabolic function below.
Observe how we now have a tangent line to the point (0.5, 7.03125) in our graph — that’s essentially what the boxed part of the function is doing. Essentially, finding the slope of that point (think back to physics where you tried to find the instantaneous velocity because it’s quite similar. Now that part will have a positive value which will be even higher in magnitude once multiplied by the learning rate. Here’s the really interesting part, why do we subtract this value from the previous parameter?
The point on the left has a negative slope, however, our goal is on the right side of this point. The negative value of the boxed part in the formula multiplied by a negative sign should produce a positive value that is added to the parameter — increasing the x-value (θ₁) to go towards the right side(closer to our goal). Well, what about the point on the right? Since the point on the right has a positive slope resulting in the boxed portion having a positive value, it will result in a negative number when multiplied by the negative sign in the formula. The x-value (θ₁) will then reduce, causing it to go closer to the goal which is on the left side of that point.
Due to this math, you would think that the larger we make the learning rate, “⍺”, the faster we will reach convergence. Following that logic, we should increase the learning rate as much as possible, right? Well…not exactly.
If we crank up the value of the learning rate too much, divergence can occur. Essentially, instead of getting closer to our goal, we will get farther and farther away.
Well, this is a problem that machine learning developers have faced — to achieve balance with the learning rate. We can’t make the learning rate too high otherwise the best parameters will become more inaccurate instead of becoming more accurate. We also can’t make the learning rate too small otherwise it will take a really long time to find the best parameters — we need to find a general range. But, once we find that range and assign a number wouldn’t we have to continuously adjust that number so our algorithm takes smaller and smaller steps to avoid divergence? Nope! That’s right, we don’t have to. Our algorithm will take smaller steps even with a fixed learning rate.
Notice how the closer we get to the minimum of our function, the less steep the slopes become and this causes our algorithm to take smaller and smaller steps. In terms of our equation, the derivative chunk, the part with the “∂/∂”, becomes smaller and so the parameters are increasing/decreasing by a smaller chunk.
Wow! If you’ve read this far — you should pat yourself on the back. That was LONG but now you have a really deep idea as to how a machine can find the best-line fit given a set of data points. Moreover, you should now understand linear regression as well as the algorithms associated with it and the logic behind the mathematics.
If you enjoyed this topic, I would certainly recommend learning more! Here are some resources:
Thanks for reading this article. My name is Rohan, I am a 16-year-old high school student learning about disruptive technologies and I’ve chosen to start with A.I. To reach me, contact me through my email or my LinkedIn. I’d be more than glad to provide any insight or to learn insights that you may have. Additionally, I would appreciate it if you could join my monthly newsletter. Until the next article 👋!