If you want a quick model that does not require you to separate the numerical columns from categorical ones, does not require you to ordinal encode or one hot encode them, and does not require you to standardise the independent variables? If your answer is yes then maybe you need to try CatBoost.
CatBoost is an open source library, based on the concept of gradient boosting, which has been developed by the Russian company, Yandex. CatBoost is an especially powerful library because it yields state-of-the-art results without extensive data training typically required by other machine learning methods, and provides powerful out-of-the-box support for the more descriptive data formats that accompany many business problems.
In order to show that CatBoost can make predictions on categorical data that has not been encoded and scaled, I selected a very popular dataset to experiment on: Kaggle’s Ames House Price dataset, which forms part of one of their competitions on advanced regression, the link being found here:- House Prices — Advanced Regression Techniques | Kaggle
The problem statement for the Ames House Price competition reads as follows:-
“Ask a home buyer to describe their dream house, and they probably won’t begin with the height of the basement ceiling or the proximity to an east-west railroad. But this playground competition’s dataset proves that much more influences price negotiations than the number of bedrooms or a white-picket fence.
With 79 explanatory variables describing (almost) every aspect of residential homes in Ames, Iowa, this competition challenges you to predict the final price of each home.
The Ames Housing dataset was compiled by Dean De Cock for use in data science education. It’s an incredible alternative for data scientists looking for a modernized and expanded version of the often cited Boston Housing dataset.”
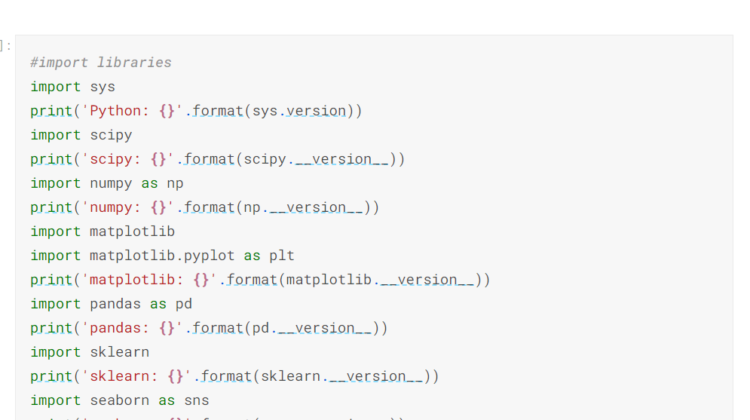
I created the program to use in my personal Kaggle account, which is slightly different from the Google Colab account that I normally use. The first step was to import the libraries that have already been installed on Kaggle’s Jupyter notebook:-
I then imported os, which provides access to the files that will be used in this competition.
I read in the files that are stored in Kaggle’s system because these files are necessary to solve the competition question:-
Once the train and test files were read into the system, I checked for any null values in the datasets. As it happens, there are quite a few values in these datasets that need to be imputed:-
In order to impute the missing values, I used a technique called arbitrary value imputation.I replaced all occurrence of missing values with the arbitrary value, -999, which is different from the mean or median, and is not within the normal values of the variable:-
I then defined the variables I would use to make predictions on the two datasets provided. The target variable, y, is train.SalePrice. X is composed of the train dataset with “Id” and “SalePrice” dropped. X_test is composed of the test dataset with “Id” dropped.
I also created a new variable, categorical_features_index, which will be used in CatBoost’s parameter tuning:-
Once the data had been preprocessed and defined, I split the X dataset up for training and validation using train_test_split:-
I then defined the model, using CatBoostRegressor. I fit the model on X_train and y_train. I also used the variable that I had previously made, categorical_features_indices, to fit the model, being part of the parameter tuning. I achieved an accuracy of 96.77% using this methodology:-
I then predicted on the validation set and achieved an accuracy of 95.59%
Once the validation set had been predicted upon successfully, I predicted on the test dataset:-
I made a dataframe, which the predictions were posited in, and saved this dataset into a .csv file. I saved the program and the .csv file was saved in Kaggle’s directory:-
I then submitted the predictions in the submission file to Kaggle and achieved a score of 0.13547. This score is slightly less than the score I had previously obtained when I used CatBoost in conjunction with sklearn’s Column Transformer function. I suspect the lower score was derived from the type of imputation used. In order to attain greater precision, it is probably best to use more highly focused types of imputation:-
The code for this post can be found in whole or in part in my personal Kaggle account, the link being found here:- Ames House Prices — CatBoost | Kaggle