To answer this question, I did some preliminary machine learning with the csv data.
I analyzed 2000 samples. Below are the first 5 training examples:
The csv_tolerable (first column) is what we want to train a model to predict. True means the csv is tolerable, false means it’s not.
duration_ms is how long the navigation took. It’s used to determine csv_tolerable. The last column, num_actions_gte_100 means whether the number of redux actions fired during navigation is greater than 100.
Of these 2000 training samples, 1000 have tolerable csv and 1000 intolerable csv.
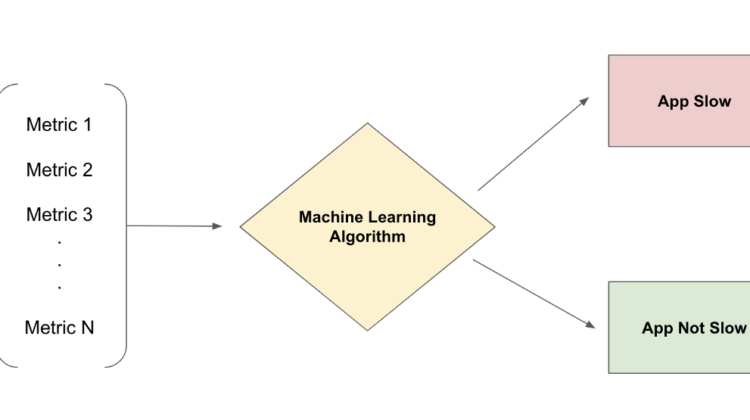
The goal here is to train a model to predict whether csv is tolerable — something employees cannot control — from other metrics that employees can control.
Before training a model I did basic data processing to:
- Separate target column (i.e. csv_tolerable).
- Remove
duration_mssince it determines csv_tolerable. - Fill in missing values (NaN => False).
- Transform categorical variables with one-hot encoding.
This is what the final input DataFrame looks like.
I then split the 2000 samples into a training set and a test set.
Now we’re ready to train a model. I used Scikit-Learn’s RandomizedSearchCV to find the best hyperparameters for my model.
from sklearn.model_selection import RandomizedSearchCV
from scipy.stats import uniformX_train, X_test, y_train, y_test = train_test_split(X, y, test_size=0.3, random_state=42)logistic = LogisticRegression(max_iter=50000, random_state=0, solver='liblinear')distributions = dict(C=uniform(loc=0, scale=10), penalty=['l2', 'l1'])random_search = RandomizedSearchCV(logistic, n_iter=100, param_distributions=distributions, random_state=2)random_search.fit(X_train, y_train)result = random_search.cv_results_
estimator = random_search.best_estimator_
score = random_search.best_score_
params = random_search.best_params_
The best params and scores were:
best score 0.666
best params {'C': 4.3532239261827685, 'penalty': 'l2'}
After training, I used the test set to evaluate the predictive power of my model.
from sklearn.metrics import f1_score
from sklearn.metrics import accuracy_score
from sklearn.metrics import recall_score
from sklearn.metrics import precision_scoreclassifier = LogisticRegression(max_iter=50000, random_state=1000, penalty='l2', C=4.3532239261827685, solver='liblinear')classifier.fit(X_train, y_train)y_pred = classifier.predict(X_test)data = {
'accuracy': [accuracy_score(y_test, y_pred)],
'precision': [precision_score(y_test, y_pred)],
'recall': [recall_score(y_test, y_pred)],
'f1 score': [f1_score(y_test, y_pred)]
}pd.DataFrame.from_dict(data, orient='index', columns=['metrics'])
I compared it to a Dummy model that predicts based on the distribution of our labels. As expected, the accuracy is around 50%, because 50% of our training data have tolerable csv.
The trained model performed significantly better than the Dummy. Therefore, I conclude that metrics directly controllable by engineers and product managers CAN be used to predict performance.