For dataset with imbalanced class, we should use precision score rather than accuracy score. A precision score of 1.0 for ‘fraud’ category means that every detected label classified as ‘fraud’ does indeed belong to it. The opposite happens when precision score is approaching 0, which means that the model fail to accurately detect a label that is indeed belong to it.
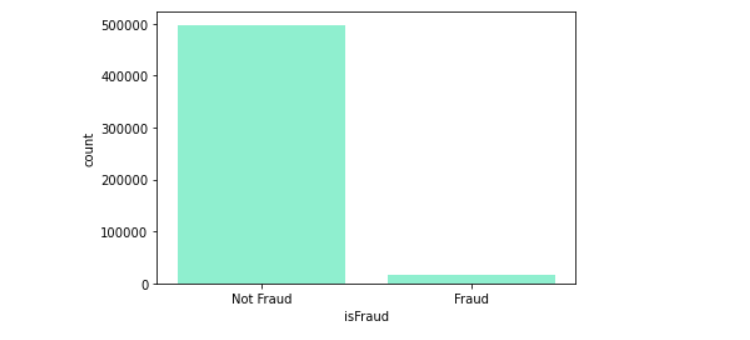
Why are the performances so poor? This is because the model will tend to learn on majority data points, neglecting the minority fraud data. There is a high risk of miss out detecting fraud transactions in the prediction.
train = train.loc[df['isFraud']==1].sample(n=4000,random_state=1234)train = train.append(train[train['isFraud']==0].sample(n=4000,random_state=1234))
sns.countplot(train['isFraud'])
After a simple data balancing, the same process is done again from dimension reduction to machine learning models. The results are as below:
Although the models accuracy is not that high, but the precision and recall for both classes are balanced.
Find the predict-probability scores
rfscore = rfmodel.predict_proba(x_test)[:,-1]
nbscore = nbmodel.predict_proba(x_test)[:,-1]
lrscore = lrmodel.predict_proba(x_test)[:,-1]
Have a look on the average precision score:
# naive bayes
average_precision_score(y_test, nbscore)# random forest
average_precision_score(y_test, rfscore)# logistic regression
average_precision_score(y_test, lrscore)
Visualizing the average precision of each model on a graph :
from sklearn.metrics import precision_recall_curverfprecision, rfrecall, _ = precision_recall_curve(y_test, rfscore)nbprecision, nbrecall, _ = precision_recall_curve(y_test, nbscore)lrprecision, lrrecall, _ = precision_recall_curve(y_test, lrscore)plt.plot(rfrecall, rfprecision, color='orange')plt.plot(nbrecall, nbprecision, color='blue')plt.plot(lrrecall, lrprecision, color='green')p1 = mpatches.Patch(color='orange', label='Random Forest AP = 0.818')
p2 = mpatches.Patch(color='blue', label='Naive Bayes AP = 0.736')p3 = mpatches.Patch(color='green', label='Logistic Regression AP = 0.781')plt.legend(handles=[p1, p2, p3])