KS Test is used to check if two continuous distributions follow the same distribution or not. Below is the Python code for performing KS Test.
# Import Libraries
import numpy as np
import seaborn as sns
from scipy import stats
import matplotlib.pyplot as plt#Generating Normal Random Variable X
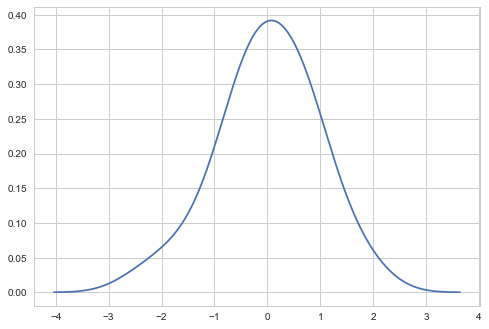
x = stats.norm.rvs(size= 100)#Draw Kernel Density Estimation Plot for X
sns.kdeplot(np.array(x),bw = 0.5)
plt.show()#Use kstest function available under scipy to compare X with Normal Distribution.
stats.kstest(x, ‘norm’)
#Output :
KstestResult(statistic=0.063772217543546034, value=0.81075786049050036)
Conclusion:
P-value is higher than the Significance level(Also known as Alpha .05 in our case) so we accept the Null Hypothesis which implies x is normally distributed.
Follow us to get more such articles.