Log Scale: Basic Understanding
In the linear scale, when we moved a fixed distance, we were adding or subtracting a fixed factor to a point.
In the logarithmic scale, when we move to the right, instead of adding, we multiply the starting point by a fixed factor. So if we move twice by a distance of 10, we multiply by 10 twice (I have chosen 10 for simplicity):
In other words, as we move, we keep multiplying or dividing by powers of 10.
In the linear scale, the absolute value of the distance and the distance itself was the same, meaning that if we moved by a distance of 2, the distance added two values. In the logarithmic, the absolute or the core value of the distance is not the same as the distance itself. It stays fixed but its value keeps increasing by the powers of the distance.
To instill this idea, think in this way. In our example of exoplanets, to plot every single planet on the plot, we needed a distance of +1,000,000 units to include points above a million. Since we don’t have that much space, the plot squished the smaller values onto a single line to fit the extremes. So the distance was the biggest problem.
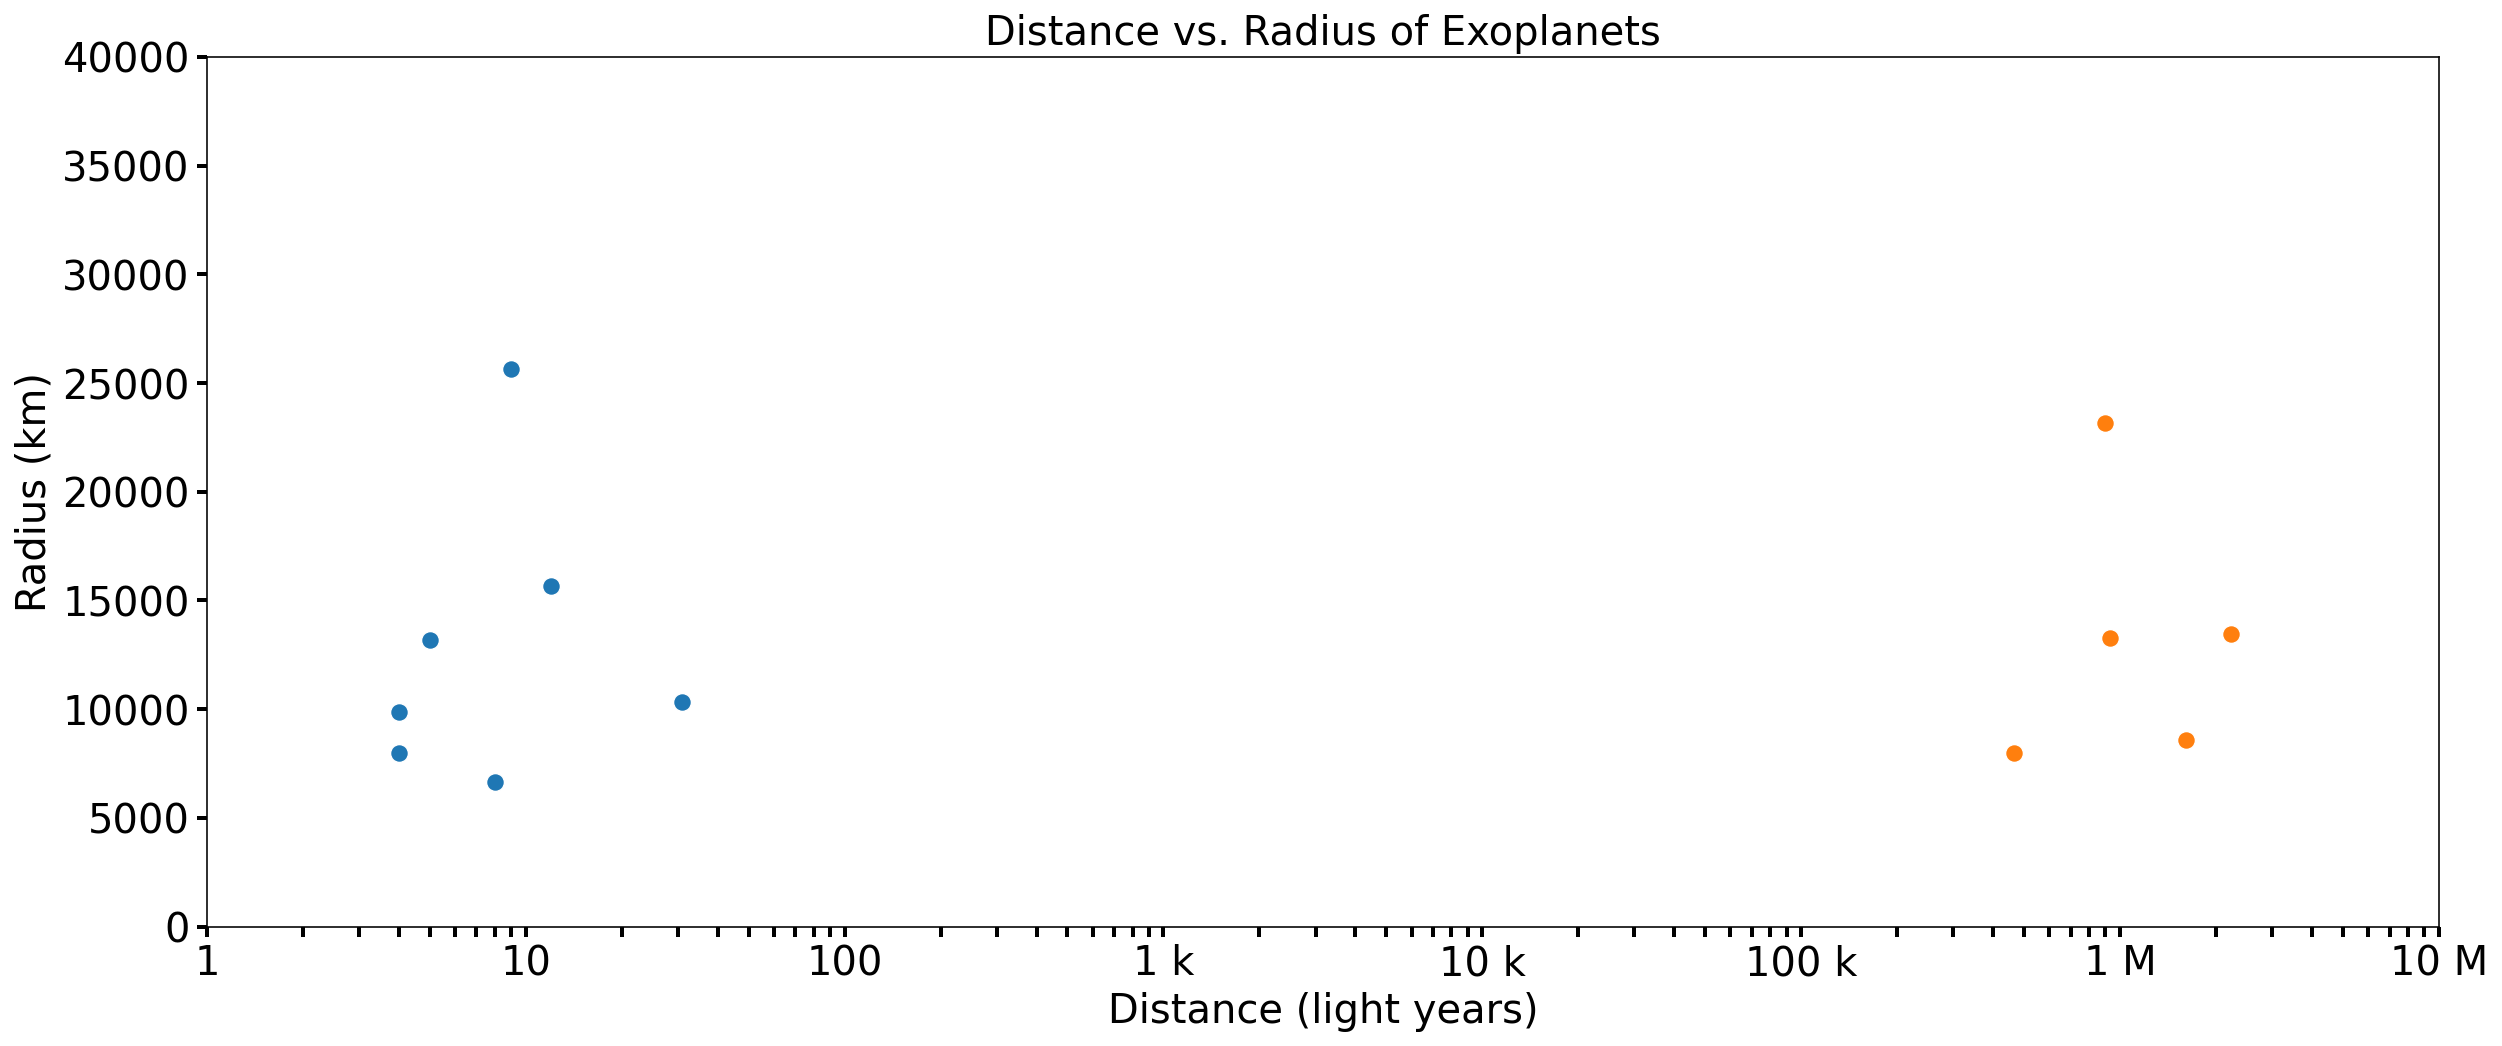
But now, if we use a logarithmic scale to plot the exoplanets, we can have an axis with a much shorter distance that covers values from 1 to above 1,000,000:

The above plot does not obscure any data and can easily plot numbers from 1 to 10 million in a much shorter axis length, courtesy of logarithms.
Note that I am not showing the code of plots yet, because I don’t want to mix the explanation of the code and log scale in a single section. We will see how to plot in log scale in detail in a later section.
Now, you might be thinking, ‘where the hell are all the logarithms?’. Well, the logarithm function will come into play when we start asking questions such as:
- How do I plot numbers which are not powers of 10?
- How do I move between two random points in a logarithmic line?
Imagine that you put a ruler below your log axis so that 0 cm is directly below 1. In this case, the distance between each point in the logarithmic scale will be 1 cm regardless of the base. For example, in base 10, 1 would be above 0 cm, 10 would above 1 cm, 100 above 2 cm, and so on.
If we change the base, the centimeters, or the points on the ruler won’t change only the values of the points above will. For base 5, 1 will still be 0 cm, 5 will be above 1 cm, 25 above 2 cm, etc.:
Now, we can ask: Where do I plot 40 on the log axis of base 6? In other words, what power do I have to raise 6 to get to 40? I think you know where I am going with this but this basically means what does log-base-6 of 40 equal to?
The result is the number of centimeters you need to move from 0 cm. So, the general formula for the distance between 0 cm and your target number is:

Using the above, we can derive a formula for moving from any random point to another:

The above formula finds the cm position of point B and subtracts the cm position of A which gives the distance between two points. Then, you add the result to the cm position of A. For example, without looking at the log scale itself, let’s find out how much in centimeters we need to move from 9 to 146 in the log scale with base 8. Using the formula:

The result is how much in centimeters you need to move from where 9 is positioned along the log axis.
Think about why we always start log scales from 1. Also, is it possible to plot negative values in a log scale?
