Presentation of the Iris dataset
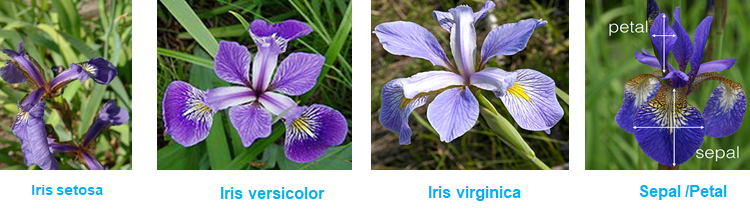
The Iris dataset is a famous multivariate dataset that was first introduced by the statistician and biologist Sir R.A Fisher in 1936 in a research paper. It collects the data to segregate three species of Iris flowers based on their morphologic variation. The data consists of 50 samples from each of the three species (150 total: 50 Iris Setosa, 50 Iris Virginica and 50 Iris Versicolor) with four features or characteristics measured from each sample (length of the sepals, width of the sepals, length of the petals and width of the petals).
The use case is simple, a botanist is trying to determine the species of an iris flower based on the four features described above. Classifying this dataset will allow us to have a good introduction and understanding of solid concepts of machine learning.
Getting to know our dataset
We will be using a Python library called sklearn (https://scikit-learn.org/), this is a great tool for classification and a good option for our specific use case. So the first thing we need to do is install this library as follow:
Run this command: $ pip install scikit-learn
The dataset is composed of four features (called data)and a target as described below by taking a look at the data from 0 to 5, 51 to 56, 101 to 106:
A better way to understand our data is to use a library called matplotlib.pyplot to plot it and visualize it, but first lets go ahead and load our data. The dataset is provided by sklearn library, so we will go ahead and import it then load the dataset.
Once we run the code, we get this plot:
Similarly, if we modify plt.scatter(, , c=irisDataSet.target) to plot all the different combination we get the following:
Next Step: Classification
Now that we have a better idea about our data, lets go ahead and use a Classification model to classify the species of Iris flowers. In the next article, we go over the K-Nearest Neighbor Classifier and apply it to this dataset.
Resources
Iris flower data set. (2021, January 20). Retrieved January 28, 2021, from https://en.wikipedia.org/wiki/Iris_flower_data_set
R.A. Fisher. “The use of multiple measurements in taxonomic problems. Annals of Eugenics”, 7(2), 179–188 (1936)