By Dr. Arnab Bose and Pronojit Saha
ML models are driving some of the most important decisions for businesses. As such it is important that these models once deployed into production remain relevant in the context of the most recent data. A model may go out of context if there is data skew i.e. data distribution may have changed in production from what was used during training. It may also be that a feature becomes unavailable in production data or that the model may no longer be relevant as the real-world environment might have changed (e.g. Covid19) or further and more simply, the user behavior may have changed. Monitoring the changes in model’s behaviour and the characteristics of the most recent data used at inference is thus of utmost importance. This ensures that the model remains relevant and/or true to the desired performance as promised during the model training phase.
An instance of such a model monitoring framework is illustrated in Fig 2 below. The objective is to track models on various metrics, the details of which we will get into the next sections. But first let us understand the motivation of a model monitoring framework.
Feedback loops play an important role in all aspects of life as well as business. Feedback loops are simple to understand: you produce something, measure information on the production, and use that information to improve production. It’s a constant cycle of monitoring and improvement. Anything that has measurable information and room for improvement can incorporate a feedback loop and ML models can certainly benefit from them.
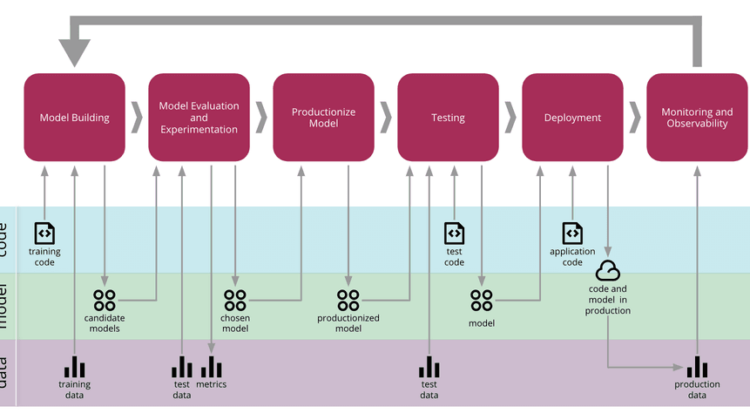
A typical ML workflow includes steps like data ingestion, pre-processing, model building & evaluation and finally deployment. However, this lacks one key aspect i.e. feedback. The primary motivation of any “model monitoring” framework thus is to create this all-important feedback loop post deployment back to the model building phase (as depicted in Fig 1). This helps the ML models to constantly improve itself by making a decision to either update the model or continue with the existing model. In order to enable this decision the framework should track & reports various model metrics (details in “Metrics” section later) under two possible scenarios described below.
1. Scenario I: The training data is available and the framework computes the said model metrics both on training data and production (inference) data post deployment and compare to make a decision.
2. Scenario II: The training data is not available and the framework computes the said model metrics based only on the data that is available post deployment.
The following table lists the inputs required by the model monitoring framework to generate the said metrics, under the two scenarios.
Based on which of the two scenarios is applicable, metrics highlighted in the next section are computed to decide if a model in production needs update or some other interventions.
A proposed model monitoring metrics stack is given in Fig 3 below. It defines three broad types of metrics based on the dependency of the metric on data and/or ML model.
- Stability Metrics — These metrics help us to capture two type of data distribution shifts:
a. Prior Probability Shift — Captures the distribution shift of the predicted outputs and/or dependent variable between either the training data and production data (scenario I) or various time frames of the production data (scenario II). Examples of these metrics include Population Stability Index (PSI), Divergence Index (Concept Shift), Error Statistic (details & definition to follow in next article of this series)
b. Covariate Shift — Captures the distribution shift of each independent variable between either the training data and production data (scenario I) or various time frames of the production data (scenario II), as applicable. Examples of these metrics include Characteristic Stability Index (CSI) & Novelty Index (details & definition to follow in next article of this series)
2. Performance Metrics — These metrics help us to detect a concept shift in data i.e. identify whether the relation between independent & dependent variables has changed (e.g. post COVID the way users purchase during festivals may have changed). They do so by examining how good or bad the existing deployed model is performing viz-a-viz when it was trained (scenario I) or during a previous time frame post deployment (scenario II). Accordingly decision can be taken to re-work the deployed model or not. Examples of these metrics include,
a. Project KPIs like RMSE, R-Square, etc for regression and accuracy, auc-roc, etc for classification.
b. Gini and KS -Statistics: A statistical measure of how well the predicted probabilities/classes are separated (only for classification models)
3. Operations Metrics — These metrics help us to determine how the deployed model is performing from an usage point of view. They are as such independent of model type, data & dont require any inputs as with the above two metrics. Examples of these metrics include,
a. # of time ML API endpoints called in the past
b. Latency when calling ML API endpoints
c. IO/Memory/CPU usage when performing prediction
d. System uptime
e. Disk utilization
In the next blogs of the series we will get into more details of the various Stability & Performance metrics and we will see how we can use them to build our model monitoring framework.