Model Building
Let us build the model and analyse how well the values have translated into the model.
from statsmodels.tsa.arima_model import ARIMA
# ARIMA order (p,d,q)
model = ARIMA(df.Sales, order=(1,1,2))
model_fit = model.fit(disp=0)
print(model_fit.summary())
The model can be improved further and a lot of tuning can be done on it, but a point to note however is the small size of the series and thus limited accurate result.
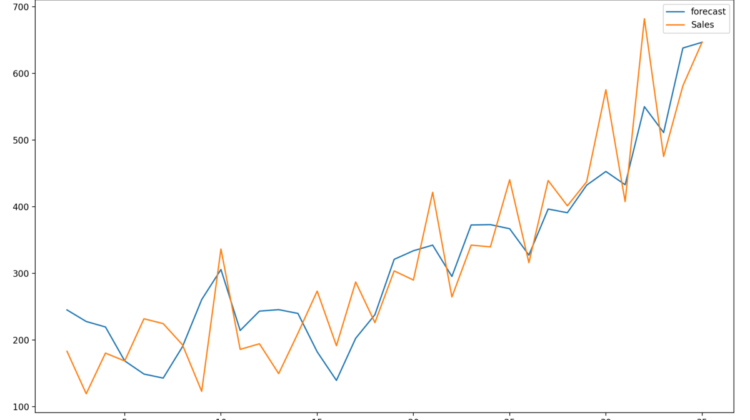
Let us forecast and also look for accuracy,
model_fit.plot_predict(dynamic=False)
plt.show()
The results aren’t satisfactory, but it’s good to get an idea of how ARIMA works. Let’s do a quick accuracy metric check on the same to see how well can the model forecast future values.
import numpy as npmodel = ARIMA(train, order=(1, 1, 2))
fitted = model.fit(disp=-1)# Forecast
fc, se, conf = fitted.forecast(6, alpha=0.05)mape = np.mean(np.abs(fc - test)/np.abs(test))  # MAPE
The MAPE is 17.99, that means the model’s accuracy is 82.11%.