Right now, Education is very important issue regarding development of any country. The main objective of educational institutions or college is to provide high quality education to their students. One way to solve this is by predicting student’s academic performance early and thereby taking early steps to improve student’s performance and teaching quality. So, with the mindset that learn by doing is the most effective technique, I set out to do an AI project using Different Regression as my machine learning model of choice.
Student marks Prediction is a way of predicting a student marks based on his/her previous marks. This also makes the teachers to know whether students are in a position to reach his/her expected marks or not. If this model shows that student needs to improve then that student can prepare more for that semester so that he/she can reach their expected marks or grade.
Main objective for this project is to help teachers to analyze students performance easily and if needed they can help her/him to improve their student’s performance by taking some actions like increasing their reading hours, giving some assignments etc..
I like to focus on using real-world data, and in this project, we will be exploring student performance data collected from a Portuguese secondary (high) school. The data includes personal and academic attributes of the students along with final semester grades. Our objective will be to create a model that can predict grades based on the student’s information. This dataset, along with many other useful things for testing models or trying out machine learning techniques, is available on the UCI Machine Learning Repository.
In this marks prediction system I had used four different regression techniques to predict the Final Marks.
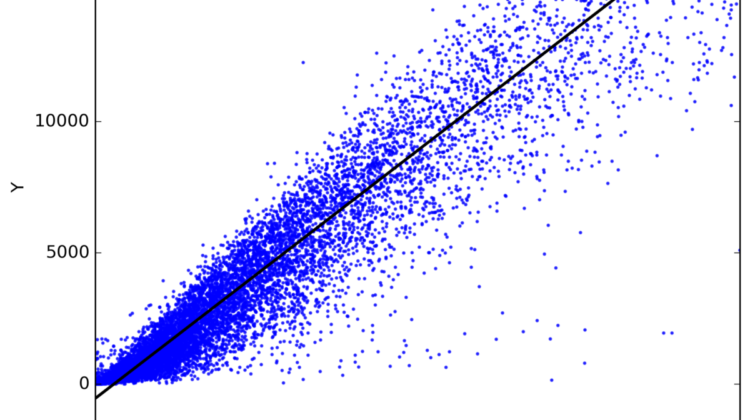
Linear regression attempts to model the relationship between two variables by fitting a linear equation to observed data. One variable is considered to be an explanatory variable, and the other is considered to be a dependent variable.
Linear regression is a linear model, e.g. a model that assumes a linear relationship between the input variables (x) and the single output variable (y). More specifically, that y can be calculated from a linear combination of the input variables (x).
When there is a single input variable (x), the method is referred to as simple linear regression. When there are multiple input variables, literature from statistics often refers to the method as multiple linear regression.
A random forest is a meta estimator that fits a number of classifying decision trees on various sub-samples of the dataset and uses averaging to improve the predictive accuracy and control over-fitting.
Random forest is a Supervised Learning algorithm which uses ensemble learning method for classification and regression.
Gradient boosting is a technique attracting attention for its prediction speed and accuracy, especially with large and complex data. Gradient boosting is a type of machine learning boosting. The key idea is to set the target outcomes for this next model in order to minimize the error.
- If a small change in the prediction for a case causes a large drop in error, then next target outcome of the case is a high value. Predictions from the new model that are close to its targets will reduce the error.
- If a small change in the prediction for a case causes no change in error, then next target outcome of the case is zero. Changing this prediction does not decrease the error.
Bayesian regression allows a natural mechanism to survive insufficient data or poorly distributed data by formulating linear regression using probability distributors rather than point estimates. The output or response ‘y’ is assumed to drawn from a probability distribution rather than estimated as a single value.
Advantages
- Very effective when the size of the dataset is small.
- The Bayesian approach is a tried and tested approach and is very robust, mathematically. So, one can use this without having any extra prior knowledge about the dataset.
Disadvantages
- The inference of the model can be time-consuming.
- If there is a large amount of data available for our dataset, the Bayesian approach is not worth it and the regular frequentist approach does a more efficient job
Import the necessary libraries.
import numpy as np
import pandas as pd
import matplotlib.pyplot as plt
First let’s look as a dataset as a pandas data frame, here is the dataset which we included in our project which has 33 different attributes and total 395 data .
In this dataset there are 3 types of grade and other attributes like travel time, study time, free time, parents contribution status like living together or not and absence of students etc.