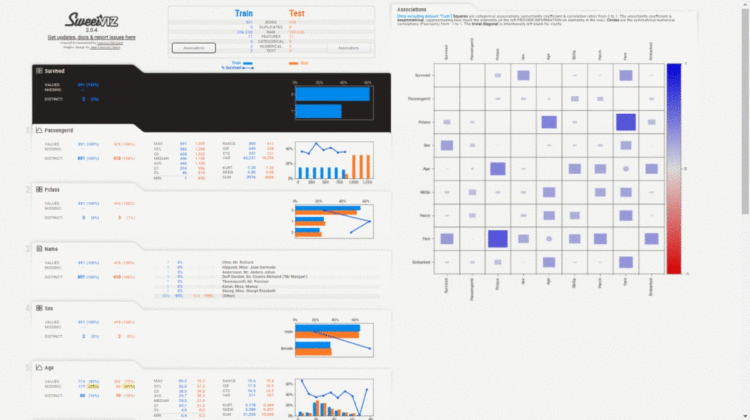
Sweetviz is an open-source python library that can do exploratory data analysis in very lines of code. It generates beautiful and annotated plots for visualization. Sweetviz library is built on top of pandas profiling library, and some of the type detection codes and inspirations are taken from pandas profiling library.
Sweetviz has Jupyter Notebook, Google Colab, and other notebook integration, with UI features such as report size scaling and vertical layout. It can do in-depth EDA including target analysis, comparison within a dataset or train test data, feature analysis, correlation, etc in just 2 lines of code.
The output report can be displayed in HTML format or it also includes a notebook integration feature.
Installation:
Install the sweetviz library using pip:
pip install sweetviz
About the dataset: For further analysis, the dataset used is Titanic dataset from Kaggle.
1. Create a dataframe report using:
- sweetviz.analyze()
- sweetviz.compare()
- sweetviz.compare_intra()
sweetviz.analyze():
report = sweetviz.analyze([train_data, "Train"],
target_feat='Survived')
This functions is used to analyze the training dataset and return with the exploratory data analysis report.
sweetviz.compare():
report = sweetviz.compare([train_data, "Train"], [test_data, "Test"], target_feat='Survived')
This function is to do the exploratory data analysis comparing two datasets, all the visualization plots and analysis reports will be generated comparing the two datasets. The two datasets can be train and test data.
sweetviz.compare_intra():
report = sweetviz.compare_intra(train_data, train_data["Sex"] == "male", ["male", "female"])
Comparing by splitting the dataset into two or more sub-population, and generating the insights.
2. Generate the report in either HTML format or in the notebook itself:
Once the object of the report is generated using either of the functions (analyze(), compare(), compare_intra()), the report can be displayed using two functions
- sweetviz.show_html(‘report.html’): Generate the report in a HTML file.
- sweetviz.show_notebook(): Displays the report right inside a notebook (e.g. Jupyter, Google Colab, etc.).
