- The Red Box Plot shows that the Whiskers value is set to the Minimum and the Maximum value in the Dataset. Hence the whisker grabs all the extreme points with it and thus there seems to be no outliers in the Dataset.
- The Yellow Box Plot shows that the Whisker value is set to the Quartiles value(Q1 & Q3) and hence the whisker doesn’t grab the value beyond the Quartile1 and Quartile3.Thus in this plot, all the values that are present outside of the box is considered to be as an outlier.
In both the cases the Whisker does a bad job.
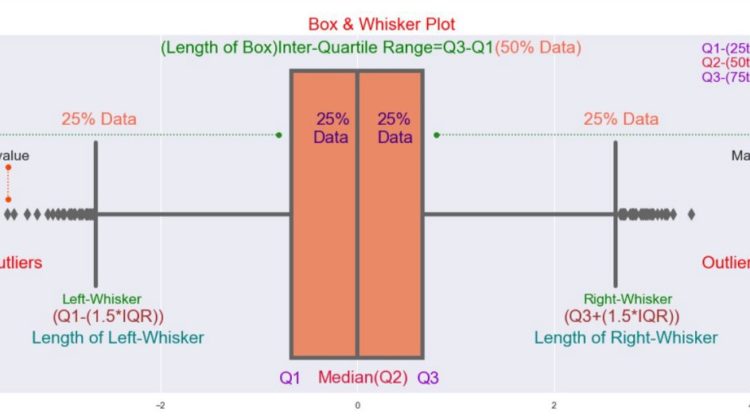
So the correct value of whisker’s hand must be based on the following Formula
Left Whisker =(Q3-(1.5*IQR)) & Right Whisker =(Q3+(1.5*IQR))
By using this formula we can identify the outliers and also grab the required and important information about the variable.
The only drawback of the boxplot is that it doesn’t display all the data points but it is the best to get a quick 5-point summary of the Data.