Step 1, Generate Data
We used Grasshopper 3D, a well-known architectural design tool, to generate our training data set. The advantage of Grasshopper 3D for generating the data, is that it uses a visual interface that makes it easy for non-coder designers to get involved. On an average the professionals would spend close to 60–80% of the time cleaning and wrangling the data. Preprocessing would take up a lot of effort and of course time, if we used some available dataset.
Since we generated the data, we have more control over the data we will be using as the inputs, and we could eliminate the pre-processing step.
We wrote a script in Rhinoceros 3D’s visual programming language “Grasshopper” which generated the number of parking spots for a given set of parameters of a polygon :
- Area of the polygon
- Perimeter of the polygon
From Grasshopper 3D, we can create a CSV (Comma Separated Values) file that can be imported into python for model training in step 2.
Step 2, Train and Predict
The next step is to train our Machine Learning model. A Machine Learning model is a file that has been trained to recognize hidden relationships between features in a dataset. At this step, input features (Predictor variables) are mapped to the variables we are predicting (Target variable). These learned patterns are then applied to testing data’s input features to predict the required outcomes which are the labels.
In this project we compared the results of few of the popular and explainable machine learning regression algorithms :
- Linear Regression
- K-Nearest Neighbor Regression
- Random Forest Regression
We further used Stacking, which is a method to combine the strength of different estimators. All the estimators, we used so far; Linear Regression, K-Nearest Neighbor Regression, and Random Forest Regression are individually fit on our training dataset, while a final estimator is trained using the stacked predictions of these base estimators, which will combine the strengths of the different regressors.
Assessing Results
The metric we used to evaluate is R² value (proportion of the variance in the dependent variable that is predictable from the independent variable), which has the best possible score of 1.0 . For initial phase we got the R² value for:
- Linear Regression : 0.98
- K-Nearest Neighbor Regression 0.992
- Random Forest Regression : 0.994
The Stacked Regression resulted in a very high R² value of 0.997, which is great !
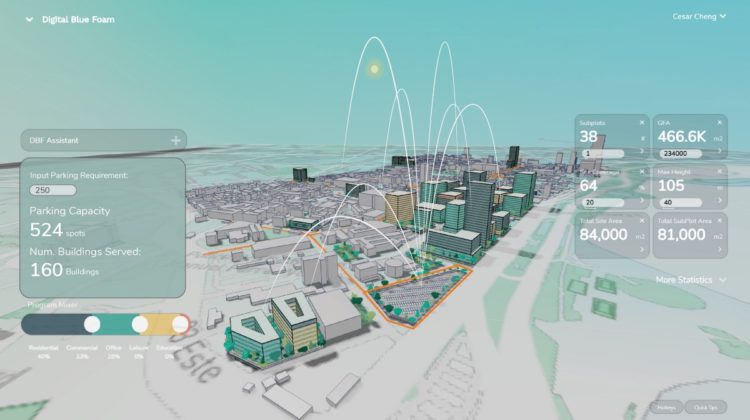
Step 3, Visualizing and Compare
Using Digital Blue Foam we can quickly visualize and compare different scenarios. For each, we calculate parking capacity and average walking distance for new developments in the study area.