For data scientists, ML Engineers, ML developers, search engine enthusiasts.
Search engines and Top-K rankings are difficult to compare and are often difficult to justify. Top-K rankings are usually evaluated with several common criteria:
- Top results are more important than bottom-ranked results
- A drop from 2nd to 3rd is more significant than a drop from 5th to 6th and so on…
- A specific result not appearing in another list is most important than a result dropping in the other list as it suggests the ranking itself is > K.
In light of this, I found little literature that actually proposed a statistical comparison of Top-K comparisons. Common methodologies included Kendall-Tau and Spearman Rho’s Rank correlation but these only capture finite lists and do not quite answer the problem. In other words, they are only able to compare lists they have ranked all n of their results. However, I stumbled upon a different statistical solution that solved the aforementioned problem — Rank Biased Overlap. It suggested an interesting way to compare ranks between results that I had not seen in other algorithms or explored in other blogs to its fullest extent.
The rest of this blog will be discussing rank-biased overlap with an illustration of the problem while also trying to illustrate how to maximise its use in comparing lists. Some of which are built into Vector AI as comparative tools for search. These are linked below that can be explored by users.
The formula, which has been nicely refactored in the paper, can be shown below:
The astute reader will immediately notice that the p as just a weighting factor is not immediately intuitive. The question is then why use something so complex?
Let us reconsider this from a different perspective.
Let us consider the similarity as such
Now, to fulfil the criteria of rank-based importance, we want 2 simple things:
1) The weights to be of decreasing importance.
2) The sum of the weights to be finite-bound (convergent) to allow for interpretation. In other words — we want the scale for RBO to be from 0 to 1 so that we can interpret if results are good.
The simplest implementation of that is the geometric series. As we want the sum of weights to be 1, we multiply both sides with (1-p) and then set w to the values below.
This then derives us RBO — which is a fantastic metric for comparing Top-K lists.
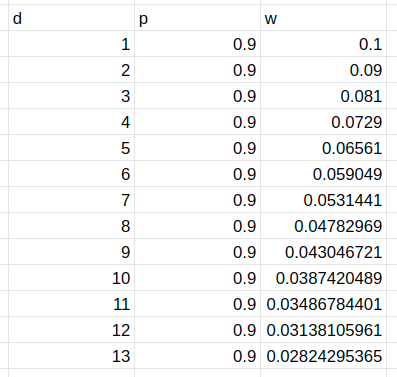
However, practitioners will then ask — what is a good value for p? The original paper used p = 0.9 for the weighting to occur but I personally believe it is much easier to interpret these when you have the weightings.
Based on the above formula, we get the following weights at each rank:
If we explore this behavior on the extremes of p, we notice that if p was close to 0, the weightings are biased very much to the top results:
Conversely, if close to 1, the weightings are biased towards evening the result weightings.
Furthermore — an added advantage of RBO is that it can be extended to compare uneven lists, which is not possible with other statistical methods and comparisons.
Let us consider another positive attribute of RBO — modelling how an item in position 2 in list 1 dropping down to position 6 in list 2 is captured differently to it dropping out of the list. We can immediately see that at position 6, the intersection between the 2 is once-again captured at lower weighting in the first instance but is not included in the second instance. This simple method of calculating the intersection provides a great way to compare search results at differing positions!
RBO provides an easy-to-calculate way of calculating these results. Through clever hash-table implementations that allow for quick calculation of intersections and a clever weighting scheme, we are able to use RBO as a great statistic for comparing Top-K ranks.
At Vector AI, we provide working implementations and visualisations for search results and have also built in-house Top-K visual comparison methods to better analyse search results from creative new angles. If you would like to request a demo of some of these and explore what we offer for cloud-hosted search engines, feel free to send a message at getvectorai.com!