We attempt to measure how many extra or fewer deaths we had in Chile in 2020 for each one of the most important causes of deaths due to the pandemic. For this purpose, we use a counterfactual bayesian model approach.
We use public data of deaths from the Statistics and Health Information Department of Chile https://deis.minsal.cl/. This data set contains all deaths since 2016 classified by gender, age range, region, subregion (comuna), and some details on the cause of death (ice10 code and hierarchy of that code).
Our dataset has the cause of death “COVID-19” which divides into two posible details of cause
- “Confirmed COVID-19”: 75% of the COVID-19 deaths (17037 deaths)
- “Suspected COVID-19”: 25% of the COVID-19 deaths (5808 deaths)
We have one time series per cause of death. We model each one with a Bayesian nested model that is trained with data before the first reported COVID-19 death in Chile (March 22). With this in mind, the predicted deaths value (from March 22 to December 31) strives to answers the question: How many deaths would have occurred if there was no COVID-19?. With these predicted deaths we can measure how many extra or less deaths we had for each cause of death.
Model Specifications
Our model has two main components:
- We use Facebook’s Prophet to obtain an additive seasonal component with week of the year and day of the week cycles.
- We feed the additive seasonal components obtained with Prophet as control series into an autoregressive model with local tendency trained using Google’s Causal Impact.
We measure the quality of the model by training until 2018–12–31 and we predict all 2019 and compute two metrics:
- Q-APE: we measure the 75% percentile of the daily percentage error. We use this metric instead of MAPE because some of the causes of deaths have sparse time series with some zeros and the MAPE value becomes undefined. A value of P% for this metric means that 3/4 of the days, of 2019, have less than P% of forecast error.
- Coverage: Since our model is bayesian our predictions are not point prediction but rather confidence intervals (of certain confidence level) of the deaths that would happened that day. The coverage, in this case, is the percentage of days (of 2019) where the actual deaths are inside of the predicted confidence interval. We use a 90% confidence level so we would like the empirical coverage to be near 90% too.
Obs: These 11 causes of death constitute 97% of the total deaths in the pre-pandemic era
How much can we gain with the nested model?
We compare the performance of our nested model (prophet+causal impact) with a simple prophet model.
In terms of Q-APE we see that in 6 out of 12 causes of death (the blue ones) the nested model has better performance than the simple prophet model with a 3.2% mean improvement. For the 6 causes of death when the nested model is worse we see that the prophet model is only better, on average, by 0.4%
In terms of coverage we see that in 1 cause there is no difference, in 9 of 12 causes the nested model has better performance than the simple prophet model with a 3% mean improvement and, for the 2 causes of death when the nested model is worse we see that the prophet model is only better, by 0.7%, on average.
Another important thing to notice here is that the empirical coverage is close to the theoretical one (close to 90%) in most causes of death where “Respiratory system” is one of the exceptions.
All results shown below have a 90% confidence level
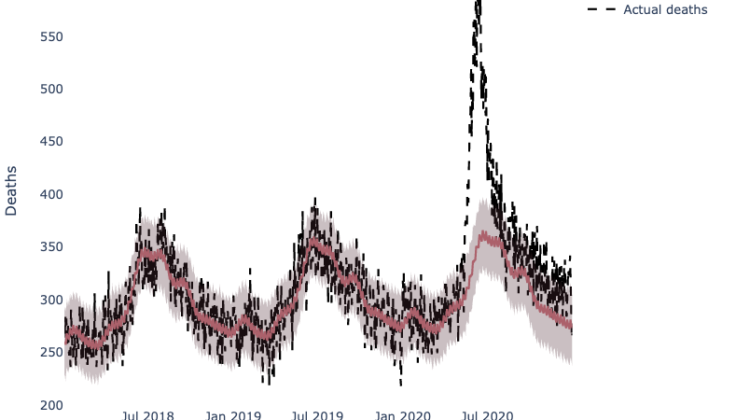
First, we see how our model predicted the total death series and we contrast the result with the actual deaths. We see a big excess from July 2020 and then a more controlled excess at the end of 2020
Second, we measure a total death excess of 13691 which is around 12% (confidence interval of [10%, 14%]) extra deaths from a normal year (see graph and table below)
Then, if we make a double click on the causes, we see that with the exception of “Abnormal symptoms and clinical laboratory findings”, there is a decrease on deaths:
There is a significant decrease on “Respiratory system” deaths probably caused by mislabeling a portion of those as suspected COVID-19. Another explanation could be that the quarantine regime, the social distance and the use of masks decreased the proliferation of other respiratory viruses. So probably a fraction of those -4200 deaths are a part of those ~6000 suspected COVID-19 deaths and the other fraction is due to the decrease of other viruses.
We see a small increase of “Abnormal symptoms and clinical and laboratory findings ”, Can we argue that this increase of deaths are caused by rare symptoms due to the COVID-19 virus?
We see a small decrease on the other causes of deaths probably due to old or sick people who would had died from these causes but ended up dying from COVID-19 instead.
Finally, we notice that suspected and confirmed COVID-19 deaths were 22845 but by our first result we only measure an increase of 13691 on the total deaths. This difference is due to our second result that shows us that, in general, other causes of deaths decrease. If we sum the 22845 COVID-19 deaths with the sum of the expected cumulative effects (of all causes) measured by our model we get a value of 14514 that is very close to the figure of 13691 measured by our model directly from the total deaths series (and of course is within the predicted confidence interval).
All code and data for this project can be found on this Github
First we train the prophet model for each cause of death and we generate a feather file with the additive component which is the input for the causal impact model.
Then we train and save the results of the causal impact model