From social media to IOT devices we generate immeasurable amount of data. Consider any service provider around you like zomato, ola, uber, etc. What makes them rich? Answer is Data. Data makes them very rich. Wait! But Is data enough to grow a business? NO, it isn’t. You must know how to use the data to draw useful insights and solve problems. This is where Data Science comes in.
In simple words, Data Science is the process of using data to find solutions/ to predict outcomes for a problem statement.
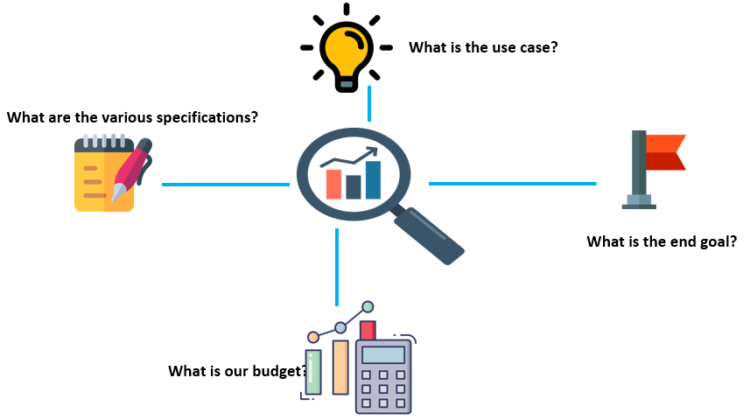
- Concept Study: It involves understanding the business problem, asking questions, get a good understanding of the business model, meet up with all the stakeholders, understand what kind of data is available, all that is part of the first step.
So, above are the few examples we want to see what are the various specifications and what is the end goal, what is our budget , is there any example of this kind of problem that has been maybe solved earlier, All this is the part of Concept Study.
2. Data Preparation: Next step in this process is data preparation. Data gathering and data preparation also known as Data Munching or sometimes it is also known as Data Manipulation. So, what happens here is the raw data that is available may not be usable in its current format for various reasons. So, that’s why In this step a Data Scientist would explore the data. It will take a look at some sample data, maybe there are millions of records, pick a few thousand records and see, How the data is looking? Are there any gaps? Is the structure appropriate to be fed into the system? Are there some columns which are probably not adding value, may not be required for the analysis? And very often these are like names of the customers they will probably not add any value or much value from an analysis perspective. The structure of the data, maybe the data is coming from multiple data sources and the structures may not be matching. What are the other problems, there may be gaps in the data so the data all the columns, all the cells are not field, If you’re talking about structured data, there are several blank records or blank columns, so if you use that data directly, you’ll get errors or you’ll get inaccurate results. So How do you either get rid of the data or How do you fill this gaps with something meaningful. So, all this is a part of Data Munching or Data Manipulation.
So, there are some additional processes in Data Preparation:
Data Integration: is a process in which heterogeneous data is retrieved and combined as an incorporated form and structure. Data integration allows different data types (such as data sets, documents and tables) to be merged by users, organizations and applications, for use as personal or business processes and/or functions.
Data Transformation: is the process of converting data from one format to another, typically from the format of a source system into the required format of a destination system. Data transformation is a component of most data integration and data management tasks, such as data wrangling and data warehousing.
Data reduction: is a process that reduced the volume of original data and represents it in a much smaller volume. Data reduction techniques ensure the integrity of data while reducing the data.
Data Cleaning: In this step, the identified data errors are corrected to create complete and accurate data sets that are ready to be processed and analyzed. For example, faulty data is removed or fixed, missing values are filled in and inconsistent entries are harmonized.
Missing data is a deceptively tricky issue in applied machine learning.
First, just to be clear, you cannot simply ignore missing values in your dataset. You must handle them in some way for the very practical reason that most algorithms do not accept missing values. The 2 most commonly recommended ways of dealing with missing data.
They are:
- Dropping observations that have missing values
- Imputing the missing values based on other observations
Dropping missing values is sub-optimal because when you drop observations, you drop information.
- The fact that the value was missing may be informative in itself.
- Plus, in the real world, you often need to make predictions on new data even if some of the features are missing!
Imputing missing values is sub-optimal because the value was originally missing but you filled it in, which always leads to a loss in information, no matter how sophisticated your imputation method is.
- Again, “missingness” is almost always informative in itself, and you should tell your algorithm if a value was missing.
- Even if you build a model to impute your values, you’re not adding any real information. You’re just reinforcing the patterns already provided by other features.
3. Model Planning: Now, the next step is Model Planning. Models can be statistical, colud be machine learning model. So you need to decide what kind of models you’re going to use. Again it depends on what kind of problem you’re working on.
The step involves Exploratory Data Analysis(EDA) to understand the relation between variables and to see what the data can tell us. Key variables are selected.
Exploratory Data Analysis(EDA): deeper analysis of dataset to better understand the data.
Goals of EDA:
- Know the datatypes and answer questions with the data
- Understand how data is distributed.
- Identify outliers.
- Identify patterns, if any.
For Example: You’re working on a Machine Learning project. So, once you’re decided with your data, With your model, With your Algorithm you’re going to use in your Machine Learning Project. You need to pass your training data, and once the training is done, you feel it is giving good accuracy, then you move on to test. Now, the Test Data is used to check the accuracy or how well our model is performing and if there are further issues, Let say model is not accurate during testing, they you may need to retrain your model or maybe with different model. After model pass here, then it’ll be further sent to production phase.
4. Model Planning: using various analytical tools and techniques, data is transformed with the goal of discovering useful information to build the right model.
Tools :
Rand PL/R, Octave, WEKA, Python
5. Result Communication : Now is the time to check if those criteria are met by the tests you have run in the previous phase.
The communication step starts with a collaboration with major stakeholders to determine if the project results are a success or failure. The project team is required to identify the key findings of the analysis, measure the business value associated with the result, and produce a narrative to summarise and convey the results to the stakeholders.
6. Operationalize: As your data analytics lifecycle draws to a conclusion, the final step is to provide a detailed report with key findings, coding, briefings, technical papers/ documents to the stakeholders.
That’s all for today.
Thanks for giving your valuable time.