To address these problems we propose Elo-based Predictive Power (EPP) ranking method.
Elo measure
The Elo ranking system is used for calculating the relative skill levels of players in games, such as chess or soccer but Elo is also popular in MOBA (Multiplayer online battle arena) games.
The difference in Elo scores of two players is a predictor of their match result. Elo is calculated based on the player’s historical wins and losses. After each match winner gains Elo points and the loser loses points. The amount of gained/lost points depends on the strength of the opponent. Winning against a better player gives more Elo points. The most important property of Elo is that the difference between two scores can be transformed into the probability of a player’s win against the opponent.
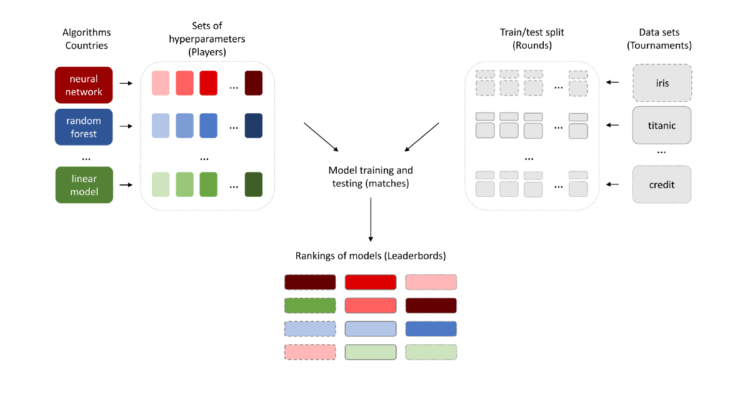
The idea of the Elo rating measure can be transferred into the Machine Learning world. The EPP — a concept of Elo for ranking ML models, is in the diagram below. Colors represent machine learning algorithms, gradients represent sets of hyperparameters, border styles represent data sets.
One can think of the ratings of models as ratings of players in the tournaments with the Elo system. Each data set is a tournament. Each algorithm can have different values of hyperparameters, such as countries that have players who represent them. Sets of hyperparameters (players) are compared on different data sets (tournaments) divided into train/test splits (rounds). There might be only one split such as in VTAB. The measures of model performances on test splits (results of matches) are aggregated into the Elo ratings. Elo for machine learning models we call EPP due to differences in the way the rankings are estimated.
EPP Ranks for VTAB
Below, we show the comparison of the mean score and EPP for models included in the Visual Adaptation Benchmark. Each black dot represents one model, the overall trend for the mean score and EPP is similar, however, there are some differences in the rankings. For example, Semi-Rotation-10% has a higher mean than Rotation, but lower EPP. It is caused by the fact that EPP only takes into account whether a model was better or worse than another, while the mean depends on the difference in results.
As we can see, the mean for the top 2 models is almost the same, but with the EPP scores, we can calculate the probability that on a new data set Sup-Rotation-100% will perform better than Sup-Exemplar-100%. The probability of winning is the inverse logit of the difference of scores. Therefore Sup-Rotation-100% (EPP=3.41) will obtain higher performance than Sup-Exemplar-100% (EPP=3.16) with the probability equals exp(3.41–3.16)/(1+exp(3.41–3.16)) = 0.56.