The Machine Learning Bite Size Series is aimed at explaining the terms in a simple 1 minute read for a quick reference.
Suppose you’re training a machine learning model and generating predictions, you compare the predicated value with the actual targets and generate a loss value, depending on the comparison of the output.
The formula for computing the loss value for Hinge Loss (l) is
l = Hinge loss
𝑦 = prediction
𝑡 = actual target for the prediction , assume 𝑡 is either +1 or -1
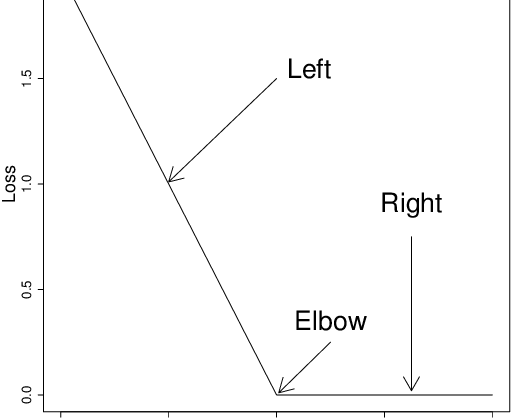
- Correct prediction 𝑡=𝑦 , loss is 𝑚𝑎𝑥(0,1–1)=𝑚𝑎𝑥(0,0)=0
- [Low Loss] Incorrect prediction 𝑡≠𝑦, loss is 𝑚𝑎𝑥(0, 1-t*y) , e.g. 𝑡=1 while 𝑦=0.9, loss would be (max(0, 0.1) = 0.1
- [High Loss] Incorrect prediction 𝑡≠𝑦, loss is 𝑚𝑎𝑥(0, 1-t*y) , e.g. 𝑡=1 while 𝑦=-2, loss would be (max(0, 3) = 3
Hence hinge loss will be higher for higher inaccuracies in prediction
Effectively hinge loss will attempt to maximize the decision boundary between the two groups that must be discriminated.