By Mr. Data Science
Throughout this article, I will:
- Show you how to import individual and multi stock datasets using the yfinance library
- Describe several techniques you can use to visualize stock data
I’ll assume:
- Python is installed on your machine and you can install necessary libraries on your own
- You are familiar with the python programming language and its syntax
Setting Up Your Environment:
Before we get started, you will need to install the following Python libraries.
- numpy — A python library for scientific computing
- pandas — A python library for data manipulation and analysis.
- matplotlib — A python library for creating static, animated, and interactive visualizations
- yfinance — A python library that offers “a reliable, threaded, and Pythonic way to download historical market data from Yahoo! finance.”
Importing Stock Data
To get individual stock data, we can use the yfinance Python library to do the heavy lifting. Start by importing the necessary libraries and defining a ticker symbol string. For this tutorial, we will use the ticker for Google, GOOG.
import numpy as np
import pandas as pd
import matplotlib.pyplot as plt
import yfinance as yfticker = 'GOOG'
Next, use your ticker string to create a ticker object with yfinance. The newly created ticker object will have built in functions that facilitate data requests.
# get information
yf_ticker = yf.Ticker(ticker)
Using the ticker object, you can obtain high level stock information by calling the info dictionary as shown below. Note that I am using json.dumps to make things a little prettier.
import jsoninfo = yf_ticker.info
print('Info:')
Info:
print(json.dumps(info, indent=2))
{
"zip": "94043",
"sector": "Communication Services",
"fullTimeEmployees": 135301,
"longBusinessSummary": "Alphabet Inc. provides online advertising services in the United States, Europe, the Middle East, Africa, the Asia-Pacific, Canada, and Latin America. The company offers performance and brand advertising services. It operates through Google Services, Google Cloud, and Other Bets segments. The Google Services segment provides products and services, such as ads, Android, Chrome, hardware, Google Maps, Google Play, Search, and YouTube, as well as technical infrastructure; and digital content. The Google Cloud segment offers infrastructure and data analytics platforms, collaboration tools, and other services for enterprise customers. The Other Bets segment sells internet and TV services, as well as licensing and research and development services. The company was founded in 1998 and is headquartered in Mountain View, California.",
"city": "Mountain View",
"phone": "650-253-0000",
"state": "CA",
"country": "United States",
"companyOfficers": [],
"website": "http://www.abc.xyz",
"maxAge": 1,
"address1": "1600 Amphitheatre Parkway",
"industry": "Internet Content & Information",
"previousClose": 2117.2,
"regularMarketOpen": 2119.27,
"twoHundredDayAverage": 1698.9875,
"trailingAnnualDividendYield": null,
"payoutRatio": 0,
"volume24Hr": null,
"regularMarketDayHigh": 2130.42,
"navPrice": null,
"averageDailyVolume10Day": 1097516,
"totalAssets": null,
"regularMarketPreviousClose": 2117.2,
"fiftyDayAverage": 1919.9679,
"trailingAnnualDividendRate": null,
"open": 2119.27,
"toCurrency": null,
"averageVolume10days": 1097516,
"expireDate": null,
"yield": null,
"algorithm": null,
"dividendRate": null,
"exDividendDate": null,
"beta": 0.989861,
"circulatingSupply": null,
"startDate": null,
"regularMarketDayLow": 2097.44,
"priceHint": 2,
"currency": "USD",
"trailingPE": 35.84768,
"regularMarketVolume": 1457612,
"lastMarket": null,
"maxSupply": null,
"openInterest": null,
"marketCap": 1412182310912,
"volumeAllCurrencies": null,
"strikePrice": null,
"averageVolume": 1554656,
"priceToSalesTrailing12Months": 7.7368407,
"dayLow": 2097.44,
"ask": 2110,
"ytdReturn": null,
"askSize": 1200,
"volume": 1457612,
"fiftyTwoWeekHigh": 2152.68,
"forwardPE": 25.872921,
"fromCurrency": null,
"fiveYearAvgDividendYield": null,
"fiftyTwoWeekLow": 1013.536,
"bid": 2100.05,
"tradeable": false,
"dividendYield": null,
"bidSize": 900,
"dayHigh": 2130.42,
"exchange": "NMS",
"shortName": "Alphabet Inc.",
"longName": "Alphabet Inc.",
"exchangeTimezoneName": "America/New_York",
"exchangeTimezoneShortName": "EST",
"isEsgPopulated": false,
"gmtOffSetMilliseconds": "-18000000",
"quoteType": "EQUITY",
"symbol": "GOOG",
"messageBoardId": "finmb_29096",
"market": "us_market",
"annualHoldingsTurnover": null,
"enterpriseToRevenue": 7.164,
"beta3Year": null,
"profitMargins": 0.22062,
"enterpriseToEbitda": 23.817,
"52WeekChange": 0.47802103,
"morningStarRiskRating": null,
"forwardEps": 81.21,
"revenueQuarterlyGrowth": null,
"sharesOutstanding": 329867008,
"fundInceptionDate": null,
"annualReportExpenseRatio": null,
"bookValue": 329.586,
"sharesShort": 2526518,
"sharesPercentSharesOut": 0.0037,
"fundFamily": null,
"lastFiscalYearEnd": 1609372800,
"heldPercentInstitutions": 0.68096,
"netIncomeToCommon": 40269000704,
"trailingEps": 58.613,
"lastDividendValue": null,
"SandP52WeekChange": 0.21104872,
"priceToBook": 6.375088,
"heldPercentInsiders": 0.058579996,
"nextFiscalYearEnd": 1672444800,
"mostRecentQuarter": 1609372800,
"shortRatio": 1.51,
"sharesShortPreviousMonthDate": 1609372800,
"floatShares": 607296015,
"enterpriseValue": 1307633516544,
"threeYearAverageReturn": null,
"lastSplitDate": 1430092800,
"lastSplitFactor": "10000000:10000000",
"legalType": null,
"lastDividendDate": null,
"morningStarOverallRating": null,
"earningsQuarterlyGrowth": 0.427,
"dateShortInterest": 1611878400,
"pegRatio": 1.6,
"lastCapGain": null,
"shortPercentOfFloat": null,
"sharesShortPriorMonth": 1787813,
"impliedSharesOutstanding": 676425984,
"category": null,
"fiveYearAverageReturn": null,
"regularMarketPrice": 2119.27,
"logo_url": "https://logo.clearbit.com/abc.xyz"
}
While getting individual stock information is nice, you may want to get stock data for multiple tickers at once. This is accomplished by passing a list of strings to the “Tickers” method instead of “Ticker”. The command will return a tuple of ticker objects that can be called upon individually.
tickers = yf.Tickers(['msft','aapl','goog'])
You can access each stock’s ticker object as shown below. Note that the object is called using the “all caps” ticker symbol. If you use lower case tickers, you will receive an error.
info = tickers.tickers.GOOG.infoprint('Info:')
Info:
print(json.dumps(info, indent=2))
{
"zip": "94043",
"sector": "Communication Services",
"fullTimeEmployees": 135301,
"longBusinessSummary": "Alphabet Inc. provides online advertising services in the United States, Europe, the Middle East, Africa, the Asia-Pacific, Canada, and Latin America. The company offers performance and brand advertising services. It operates through Google Services, Google Cloud, and Other Bets segments. The Google Services segment provides products and services, such as ads, Android, Chrome, hardware, Google Maps, Google Play, Search, and YouTube, as well as technical infrastructure; and digital content. The Google Cloud segment offers infrastructure and data analytics platforms, collaboration tools, and other services for enterprise customers. The Other Bets segment sells internet and TV services, as well as licensing and research and development services. The company was founded in 1998 and is headquartered in Mountain View, California.",
"city": "Mountain View",
"phone": "650-253-0000",
"state": "CA",
"country": "United States",
"companyOfficers": [],
"website": "http://www.abc.xyz",
"maxAge": 1,
"address1": "1600 Amphitheatre Parkway",
"industry": "Internet Content & Information",
"previousClose": 2117.2,
"regularMarketOpen": 2119.27,
"twoHundredDayAverage": 1698.9875,
"trailingAnnualDividendYield": null,
"payoutRatio": 0,
"volume24Hr": null,
"regularMarketDayHigh": 2130.42,
"navPrice": null,
"averageDailyVolume10Day": 1097516,
"totalAssets": null,
"regularMarketPreviousClose": 2117.2,
"fiftyDayAverage": 1919.9679,
"trailingAnnualDividendRate": null,
"open": 2119.27,
"toCurrency": null,
"averageVolume10days": 1097516,
"expireDate": null,
"yield": null,
"algorithm": null,
"dividendRate": null,
"exDividendDate": null,
"beta": 0.989861,
"circulatingSupply": null,
"startDate": null,
"regularMarketDayLow": 2097.44,
"priceHint": 2,
"currency": "USD",
"trailingPE": 35.84768,
"regularMarketVolume": 1457612,
"lastMarket": null,
"maxSupply": null,
"openInterest": null,
"marketCap": 1412182310912,
"volumeAllCurrencies": null,
"strikePrice": null,
"averageVolume": 1554656,
"priceToSalesTrailing12Months": 7.7368407,
"dayLow": 2097.44,
"ask": 2110,
"ytdReturn": null,
"askSize": 1200,
"volume": 1457612,
"fiftyTwoWeekHigh": 2152.68,
"forwardPE": 25.872921,
"fromCurrency": null,
"fiveYearAvgDividendYield": null,
"fiftyTwoWeekLow": 1013.536,
"bid": 2100.05,
"tradeable": false,
"dividendYield": null,
"bidSize": 900,
"dayHigh": 2130.42,
"exchange": "NMS",
"shortName": "Alphabet Inc.",
"longName": "Alphabet Inc.",
"exchangeTimezoneName": "America/New_York",
"exchangeTimezoneShortName": "EST",
"isEsgPopulated": false,
"gmtOffSetMilliseconds": "-18000000",
"quoteType": "EQUITY",
"symbol": "GOOG",
"messageBoardId": "finmb_29096",
"market": "us_market",
"annualHoldingsTurnover": null,
"enterpriseToRevenue": 7.164,
"beta3Year": null,
"profitMargins": 0.22062,
"enterpriseToEbitda": 23.817,
"52WeekChange": 0.47802103,
"morningStarRiskRating": null,
"forwardEps": 81.21,
"revenueQuarterlyGrowth": null,
"sharesOutstanding": 329867008,
"fundInceptionDate": null,
"annualReportExpenseRatio": null,
"bookValue": 329.586,
"sharesShort": 2526518,
"sharesPercentSharesOut": 0.0037,
"fundFamily": null,
"lastFiscalYearEnd": 1609372800,
"heldPercentInstitutions": 0.68096,
"netIncomeToCommon": 40269000704,
"trailingEps": 58.613,
"lastDividendValue": null,
"SandP52WeekChange": 0.21104872,
"priceToBook": 6.375088,
"heldPercentInsiders": 0.058579996,
"nextFiscalYearEnd": 1672444800,
"mostRecentQuarter": 1609372800,
"shortRatio": 1.51,
"sharesShortPreviousMonthDate": 1609372800,
"floatShares": 607296015,
"enterpriseValue": 1307633516544,
"threeYearAverageReturn": null,
"lastSplitDate": 1430092800,
"lastSplitFactor": "10000000:10000000",
"legalType": null,
"lastDividendDate": null,
"morningStarOverallRating": null,
"earningsQuarterlyGrowth": 0.427,
"dateShortInterest": 1611878400,
"pegRatio": 1.6,
"lastCapGain": null,
"shortPercentOfFloat": null,
"sharesShortPriorMonth": 1787813,
"impliedSharesOutstanding": 676425984,
"category": null,
"fiveYearAverageReturn": null,
"regularMarketPrice": 2119.27,
"logo_url": "https://logo.clearbit.com/abc.xyz"
}
While the high level information provided by the info variable is nice, you will likely want to take a look at some numbers. Lets request historical data for Google’s stock using the maximum period of time that is available and print the values to see what we are working with
history = tickers.tickers.GOOG.history(period="max")print('History:')
History:
print(history)
Open High Low Close Volume
Date
2004-08-19 49.813290 51.835709 47.800831 49.982655 44871361
2004-08-20 50.316402 54.336334 50.062355 53.952770 22942874
2004-08-23 55.168217 56.528118 54.321388 54.495735 18342897
2004-08-24 55.412300 55.591629 51.591621 52.239197 15319808
2004-08-25 52.284027 53.798351 51.746044 52.802086 9232276
... ... ... ... ... ...
2021-02-12 2090.250000 2108.820068 2083.129883 2104.110107 855700
2021-02-16 2104.360107 2152.679932 2104.360107 2121.899902 1132900
2021-02-17 2100.000000 2133.659912 2098.919922 2128.310059 1070100
2021-02-18 2110.389893 2132.735107 2103.709961 2117.199951 1121600
2021-02-19 2119.270020 2130.530029 2097.409912 2101.139893 1457400Dividends Stock Splits
Date
2004-08-19 0 0.0
2004-08-20 0 0.0
2004-08-23 0 0.0
2004-08-24 0 0.0
2004-08-25 0 0.0
... ... ...
2021-02-12 0 0.0
2021-02-16 0 0.0
2021-02-17 0 0.0
2021-02-18 0 0.0
2021-02-19 0 0.0[4155 rows x 7 columns]
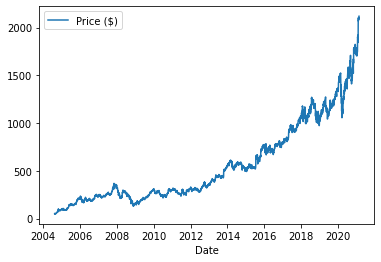
The history method above returns a Pandas dataframe that contains daily stock information (Open, High, Low, Close, Volume, Dividends, and Stock Splits) for Google. Plotting the daily “Open” data, we can see google has experienced tremendous growth over the last decade.
import matplotlib.pyplot as plt
plt.figure()
plt.plot(history.Open)
plt.xlabel('Date')
plt.legend(['Price ($)'])
plt.show()
At this point, you are ready to run off and perform all kinds of stock analyses. To help you get started, I’ve provided a couple of data visualization examples you might find helpful.
Moving Averages
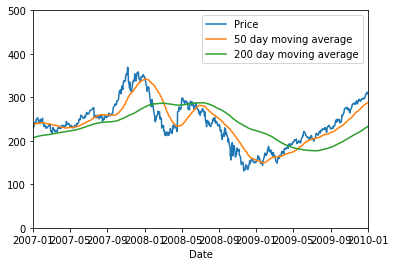
Historically, investors have relied on moving averages to help them predict a stock’s price trajectory and assess investment risk. The dreaded Death Cross technical pattern, for example, has done a pretty good job of indicating the onset of major selloffs and bear markets. To see what this looks like, lets zoom in on the 2008 financial crisis.
def moving_average(x, w):
return np.convolve(x, np.ones(w), 'same') / wma50 = history.Open.rolling(50).mean()
ma200 = history.Open.rolling(200).mean()
plt.figure()
plt.plot(history.Open)
plt.plot(ma50)
plt.plot(ma200)
plt.xlabel('Date')
plt.legend(['Price','50 day moving average','200 day moving average'])
plt.xlim([pd.to_datetime('2007-01-01'),pd.to_datetime('2010-01-01')])
plt.ylim([0,500])
plt.show()
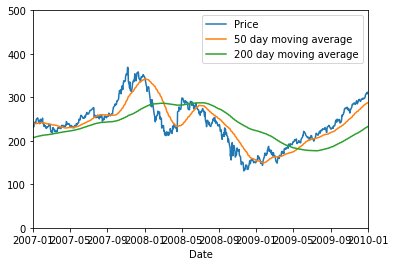
As you can see, in 2008, the 50 day average crossed below the 200 day moving average and Google’s stock went on to drop a significant amount. Later in 2009, the 50 day crossed above the 200 day average and the trend was reversed. While moving averages are good indicators of long term trends, keep in mind that they are not foolproof.
Daily Price Changes and Volatility
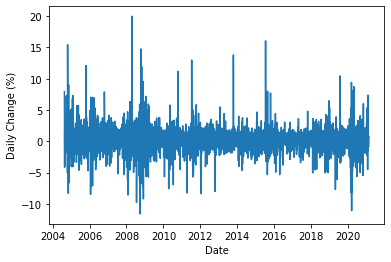
Another useful representation of stock prices is price change over a period of time. When prices climb and drop rapidly in short periods of time, we tend to say that the market is experiencing volatility. Lets take a look at Google’s price change history and some relevant statistics.
datevals = pd.to_datetime(history.index[1:].values)
oldvals = history.Close[:-1].values
newvals = history.Close[1:].valuespercent_change = (newvals-oldvals)*100/oldvals # not doing close - open because there are price changes over night
print('Daily Change History:')
plt.figure()
plt.plot(datevals, percent_change)
plt.xlabel('Date')
plt.ylabel('Daily Change (%)')
plt.show()
print(2*'n')print('Daily Change Histogram:')
plt.figure()
plt.hist(percent_change,bins=100, density=True, stacked=True)
plt.xlabel('Daily Change (%)')
plt.ylabel('Probability Density Function')
plt.show()
print(2*'n')print('Daily Change Statistics:')
Daily Change History:
print(pd.DataFrame(percent_change).describe())
print(2*'n')
Daily Change Histogram:
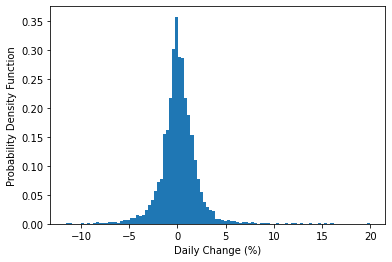
Daily Change Statistics:
0
count  4154.000000
mean      0.108455
std       1.927915
min     -11.609134
25%      -0.737066
50%       0.069319
75%       1.002336
max      19.991545
As expected, we can see increased volatility during the 2008 financial crisis, as well as several other points in Google’s history, because stock prices changed drastically (multiple standard deviations from average) in relatively short periods of time. I would venture to say you could find some interesting news articles if you searched time periods with large stock price movements.
Digging into the statistics, we can see that the average daily change in Google’s stock price hovers around 0.1% (median is a bit lower). While that doesn’t seem like a lot, keep in mind that this value indecates a daily compound interest rate, not annual. $1 would be worth significantly more after just 10 years. Another thing to note is the magnitude of the standard deviation. If you encounter a 10 percent drop or rise in Google’s stock price, ~5 standard deviations from an average price change, know that you are witnessing a unique event since this behavior is highly improbable.
A quick review of what you’ve learned:
At this point, you should have a good understanding of how to:
- Import individual and multiple stock data using the yfinance python library
- Calculate and display 50 and 200 day moving averages
- Visualize price changes and understand what they mean in terms of volatility
While there are many different options for collecting and visualizing stock data, we chose to use a combination of the yfinance, pandas, and matplotlib libraries because they were easy, intuitive, and free to use. I hope you enjoyed this article and please let me know if you have any feedback/suggestions.
References:
- Chen, James. Death Cross Definition. 2/21/2021, https://www.investopedia.com/terms/d/deathcross.asp#:~:text=The%20death%20cross%20is%20a,and%20200%2Dday%20moving%20averages.
- Yfinance. 2/21/2021. https://pypi.org/project/yfinance/
Connect With Mr. Data Science:
MrDataScience.com, GitHub, Medium,
