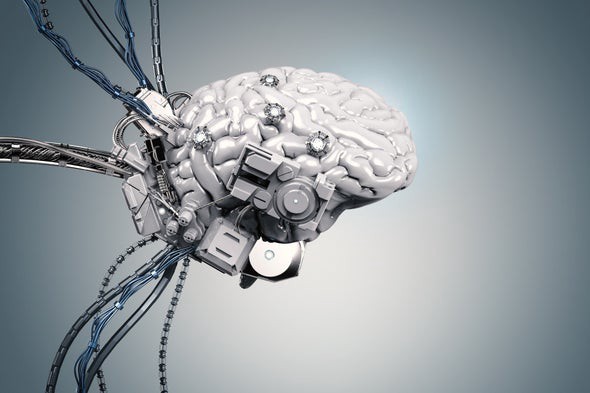
Whether you like it or not, Artificial Intelligence is taking over.
From turning your lights on to [impactful ai thing], there will likely come a point when even your job is taken over by a machine.
I mean… just look at the stats:
According to a study by the OECD:
- 14% of jobs across 32 countries have at least a 70% chance of being replaced by driverless Robots,
- With another, 32% have at least a 50% chance of the same thing.
- THAT’S 46% of jobs! Which, at current employment rates, puts 210 MILLION jobs at risk!
Well, as the old saying goes:
If you can’t beat ’em, join ‘em.
Software such as AI is such an in-demand field that many companies will hire engineers as long as they have the necessary skills, even if they don’t have a degree.
This means that YOU can become an AI engineer and reap the benefits of demand that has more than doubled in the last few years and salaries upwards of $114,121 each year. And all of that starts here with a little introduction to Machine Learning
Machine Learning, which is a widely used subset of Artificial Intelligence (AI), is the practice of making computers learn by experience. This means that, like people, the more a computer does something the better it gets.
The approaches to ML are primarily divided into two subcategories, Supervised Learning, and Unsupervised Learning.
Supervised Learning can be explained most simply as: Giving the computer both the questions AND the answers and having it figure out how to get there.
Whereas…
Unsupervised Learning is best explained as: Giving the computer data and having it find its own patterns.
With the main difference between the two being the presence (or lack thereof) of the “answers.”
Below I will explain one method that uses each type of Machine Learning and its real-world applications.
Linear Regression, a type of supervised learning, is the world’s most widely used statistical technique and it really shows. From weather forecasting to creating optimally efficient engines, it is everywhere and, as such, is going to be needed to survive this AI revolution.
Regression can best be defined as finding a continuous relationship between an input and an output and using that to predict output given new input.
So what Linear Regression basically is, is a way of looking at data and finding a continuous linear pattern between the input and output, like a line of best fit.
If you remember from 7th-grade math, we were introduced to the concept of scatter plots, which were basically a bunch of little dots of data on a graph.
And what we had to do was find the line of best fit, which is a line that best shows the pattern of the graph, which is easy if the graph looks like this:
But what if the graph looks more like this?
And how can we teach a computer how to do that?
This is where Linear Regression comes in.
So what Linear Regression does is it creates a line. And then, it measures the distances between the data points and the line, which are called Residuals.
The algorithm then adds together all of these distances and changes the line until that number is as low as possible in a process known as the Residual Sum of Squares. This is expressed in equation form as:
What the computer can then do is, it can take any input that you have and predict the output before it even happens by simply following the pattern of the line, allowing us to see the future.
K-Means Clustering is a type of Unsupervised Learning that had been widely used in things such as spam filters and clickbait detectors, as well as being an incredibly useful alternative to laboriously sorting through data.
Clustering is best defined as the process of putting data in groups so that all the data in each group has something in common the other groups do not.
K-Means Clustering is just a method to do this.
Let’s go back to those scatter plots.
When the human eye looks at this, we can clearly see three different groups of data points.
But how are we supposed to get the computer to do this?
This is where we need K-Means Clustering.
To cluster the data, we first have to tell the algorithm how many groups we want. This is the K in K-Means.
Let’s do K=3.
The algorithm would then take our K, which we decided was 3, and plot that amount of random points to serve as the center of the clusters, called centroids.
Then, going through each data point, the algorithm calculates the distance from the point to the centroids, called the mean, and groups each point into the cluster that is the closest.
Once all the data points are put into a cluster, the algorithm finds the center of each, sets that as the centroid, and repeats the process.
And repeats the process
The algorithm will keep repeating this process until the clustering no longer changes after the next iteration.
But… that doesn’t look right….
If you remember, the computer randomly chose 3 points to be our centroids, which means we don’t know if those points are the best centroids.
To remedy this, the algorithm re-does this process a set amount of times, picking a different set of centroids each time.
The algorithm then compares the Variance, which is, on average, how far the points are from their centroid.
After redoing this your set number of times, the algorithm picks the clustering with the best variance and gives it to you as your output.
Now that we have our clusters, we can give the computer any input, and it will find the closest cluster to chunk it with.
- AI is taking over the job market
- Learning AI is the best way to stay relevant in the next AI revolution
- Learning AI also comes with incredible job prospects with high salaries and unprecedented market growth.
- Machine Learning, a subtype of AI, is split into two categories, Supervised and Unsupervised Learning.
- Supervised Learning is when you teach a computer the right answers.
- Unsupervised Learning is when you teach a computer without the right answers.
- Linear Regression is a type of Supervised Learning that can be used to predict the future by finding a line of best fit.
- K-Means clustering is a type of Unsupervised Learning that can be used to group data into a certain number of clusters by finding the center of each group and comparing the points to that.