How to Get a Job at Google?
This notebook goes through Exploratory Data Analysis to build a model.
We need to find more about our data to make predictions and decide on a model. With EDA, we will figure out the details of our data and build a model accordingly.
Data
EDA varies considerably with each data set. Today, we will be looking at data to see what skills are required to get a job at Google. You can find the dataset here: https://www.kaggle.com/niyamatalmass/google-job-skills
Our data has the following features:
- Title: The title of the Job
- Category: Category of the Job
- Location: Location of the Job
- Responsibilities: Responsibilities for the Job
- Minimum Qualifications: Minimum Qualifications for the Job
- Preferred Qualifications: Preferred Qualifications for the Job
Importing the Libraries
import pandas as pd
import numpy as np
import matplotlib.pyplot as plt
import seaborn as sns
%matplotlib inline
Importing our Data
df = pd.read_csv('/Users/delaldeniztomruk/Desktop/job_skills.csv')
Describing/ Understanding the Data
df.head()

We see the how our data looks in general.
df.info()<class 'pandas.core.frame.DataFrame'>
RangeIndex: 1250 entries, 0 to 1249
Data columns (total 7 columns):
#   Column                    Non-Null Count  Dtype
---  ------                    --------------  -----
0   Company                   1250 non-null   object
1   Title                     1250 non-null   object
2   Category                  1250 non-null   object
3   Location                  1250 non-null   object
4   Responsibilities          1235 non-null   object
5   Minimum Qualifications    1236 non-null   object
6   Preferred Qualifications  1236 non-null   object
dtypes: object(7)
memory usage: 68.5+ KB
Here we can see that our data types are all objects. Since we want to fit our data to a model, we should take a note that our values ar categorical rather than numerical. Meaning our data does not include numbers and should be encoded to numbers before fitting, as models only accept numerical values
df.describe()

df.isna().sum()Company                      0
Title                        0
Category                     0
Location                     0
Responsibilities            15
Minimum Qualifications      14
Preferred Qualifications    14
dtype: int64
We see that our data have missing values in the following columns: Responsibilities, Minimum Qualifications, Preferred Qualifications Our model will not accept missing values, so we should also handle it.
df["Location"].value_counts()Mountain View, CA, United States    190
Sunnyvale, CA, United States        155
Dublin, Ireland                      87
New York, NY, United States          70
London, United Kingdom               62
...
Nairobi, Kenya                        1
Kraków, Poland                        1
Kyiv, Ukraine                         1
Moscow, ID, United States             1
Lisbon, Portugal                      1
Name: Location, Length: 92, dtype: int64
Creating Test and Training Sets
You might be asking: why are we separating those sets in the beginning? We want to make sure that our data will be able to predict the patterns and will give us a good result. However, if we and consequently our model see the test data beforehand, it will cause a data snooping bias, meaning that our estimation will also track the test data and do estimations accordingly. Thus, we need to separate our dataset to get accurate results without overfitting.
from sklearn.model_selection import train_test_split#split the dataset
train_set, test_set = train_test_split(df,
test_size = 0.2,
random_state=42)len(train_set), len(test_set)
(1000, 250)
Now, we will set our test data aside and will do our calculations based on the training data.
Visualizing the Data
First, I will create a copy of my training data to make sure that my computations will not cause a problem.
df_copy = train_set
df_copy.head()

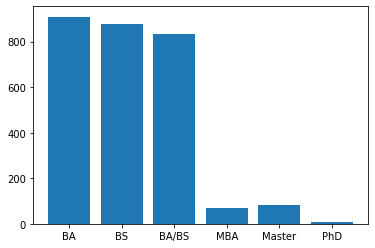
First, let’s see the education requirement for positions (if specified).
degrees = ['BA','BS','BA/BS','MBA','Master','PhD']degree_calc = dict((x,0) for x in degrees)
for i in degrees:
x = df['Minimum Qualifications'].str.contains(i).sum()
if i in degree_calc:
degree_calc[i] = xdegree_calc
{'BA': 909, 'BS': 879, 'BA/BS': 835, 'MBA': 71, 'Master': 81, 'PhD': 8}plt.bar(range(len(degree_calc)), degree_calc.values(), align='center');
plt.xticks(range(len(degree_calc)), degree_calc.keys());

Here, we see that most positions require at least BA. Good news, you might not need a PhD to get into Google!
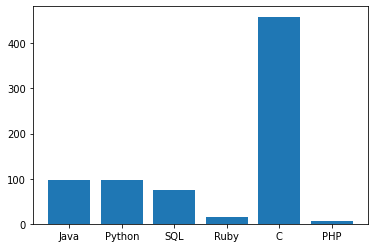
Let’s check which programming languages are desired.
prog_lang = ['Java', 'Python', 'SQL', 'Ruby', 'C', 'PHP']lang_calc = dict((x,0) for x in prog_lang)
for i in prog_lang:
x = df['Minimum Qualifications'].str.contains(i).sum()
if i in lang_calc:
lang_calc[i] = xlang_calc
{'Java': 97, 'Python': 96, 'SQL': 75, 'Ruby': 14, 'C': 459, 'PHP': 7}plt.bar(range(len(lang_calc)), lang_calc.values(), align='center');
plt.xticks(range(len(lang_calc)), lang_calc.keys());

Looks like you should be learning C 🙂
Question : It is obvious that we’ve limited our language criterias by prog_lang list. What can we do to get every language that was classified in the job postings?
