K-means is a clustering algorithm that belongs to supervised learning. You might hear of K-nearest neighbors. Both words contain the same letter “K,” such that you might think they are a similar algorithm or have something in common. However, they are different algorithms.
First of all, K-nearest neighbors is a supervised learning algorithm. This algorithm is mainly used for a non-parametric classification but also can be used for regression. On the other hand, k-means is an unsupervised algorithm that divides data into k-clusters(groups). In this article, we will discuss one of the essential clustering methods in Data Science: K-means.
On the left side, there is a line with 12 black points. We can easily separate these points into 3 clusters with our eyes. We can identify the same clusters with a computer by using k-means algorithms.
There are several steps to proceed in the k-means method. For simplicity, let us take the above example.
- Step 1: Select the number of clusters(k) you want to identify in your data. In this example, we chose three clusters.
- Step 2: Randomly select three(k) distinct data points.
- Step 3: Measure the distance between the points and the three initial clusters.
- Step 4: Assign point to the nearest cluster according to distance.
- Step 5: Calculate the mean of each cluster.
- Step 6: Assess the quality of the clustering by adding up the variation within each cluster.
- Step 7: Repeat these fundamental steps many times and compare the total variances.
After repeating these steps, we will get many results of the total variance and compare them. K-means will choose the result of the least total variance. The total variance of the example is greater than the one from the best clustering. It means that the best clustering is better than our random example such that the k-means algorithm will drop our example. So far, we have had a look at one-dimensional data. K-means clustering can be used for multi-dimensional data in the same manner. Unfortunately, K-means algorithm does not know the best clustering at the beginning. For this reason, this method must repeat the whole steps over again with different starting points.
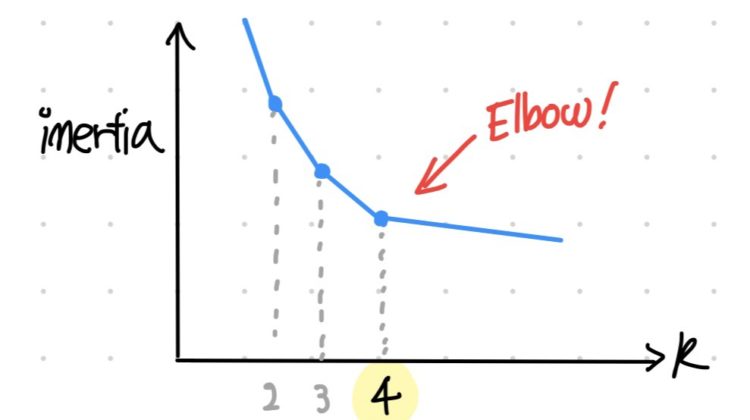
At this moment, some people might wonder how to select the number of clusters “k.” There are several ways to find the optimal value of k. The easiest way to find the optimal k is to use the “Elbow Rule.” Before having a look at the Elbow Rule, we should know what inertia is. Inertia in K-means refers to the mean squared distance between each instance and its closet centroid (Géron, 2019). Our goal is to keep the value of inertia low. However, you will have lower inertia with a greater value of k.To solve this problem, we can use the Elbow Rule by plotting the inertia as a function of k. The right choice would be at k = 4 according to Elbow Rule (plot 5).
However, choosing k through the Elbow Rule is not the best solution. For example, Elbow is sometimes unnoticeable on the plot. An alternative, more precise approach is to use the silhouette score. According to Géron, “the silhouette score, which is the mean silhouette coefficient over all the instances. An instance’s silhouette coefficient is equal to (b — a) / max(a, b), where a is the mean distance to the other instances in the same cluster (it is the mean intra-cluster distance), and b is the mean nearest-cluster distance, that is the mean distance to the instances of the next closest cluster (defined as the one that minimizes b, excluding the instance’s own cluster). The silhouette coefficient can vary between -1 and +1: a coefficient close to +1 means that the instance is well inside its own cluster and far from other clusters, while a coefficient close to 0 means that it is close to a cluster boundary, and finally a coefficient close to -1 means that the instance may have been assigned to the wrong cluster”.
<Version 1>
<Reference>
- Starmer, J , StatQuest: K-means clustering, (2018), https://www.youtube.com/watch?v=4b5d3muPQmA&t=265s (Accessed:01.02.2021)
- Géron, A, (2019), Hands-On Machine Learning with Scikit-Learn, Keras, and TensorFlow, 2nd ed., Sebastopol: O’Reilly Media, Inc.