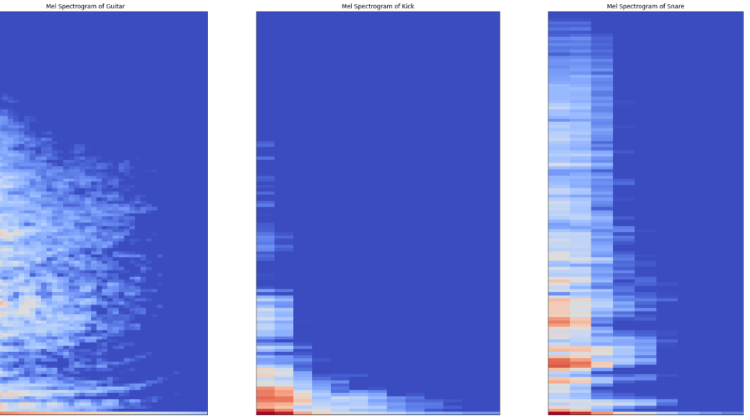
Before discussing Mel Spectrograms, we first need to understand what the Mel Scale is and why it is useful. The Mel Scale is a logarithmic transformation of a signal’s frequency. The core idea of this transformation is that sounds of equal distance on the Mel Scale are perceived to be of equal distance to humans. What does this mean?
For example, most human beings can easily tell the difference between a 100 Hz and 200 Hz sound. However, by that same token, we should assume that we can tell the difference between 1000 and 1100 Hz, right? Wrong.
It is actually much harder for humans to be able to differentiate between higher frequencies, and easier for lower frequencies. So, even though the distance between the two sets of sounds are the same, our perception of the distance is not. This is what makes the Mel Scale fundamental in Machine Learning applications to audio, as it mimics our own perception of sound.
The transformation from the Hertz scale to the Mel Scale is the following:
Note that log in this case refers to the natural logarithm (also denoted as ln.) If the logarithm were of base 10, the equation’s coefficient (1127) would alter slightly. However, in this article, we will simply refer to the equation stated above.
Let’s visualize the relationship between Hertz and Mels:
