How to detect vehicle License Plate?
In the previous article on LPD, we cover all theory part, if you haven’t check out yet please go through
License Plate Recognition (All you need to know) part 1.
- Load the pre-trained model
- Image pre-processing
- Get license plate
so in this article, I will walk you through how can we detect a license plate from a car image or we can say how we can crop a license plate from a car image.
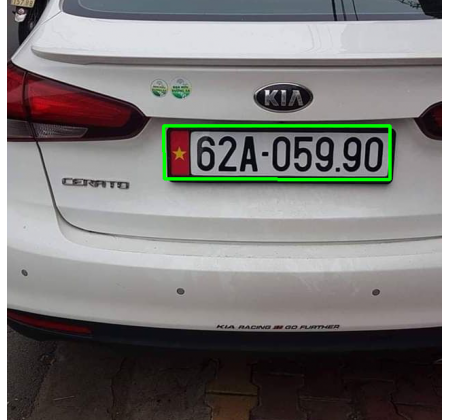
so we have a car image and we try to extract the plate part from this image.
and we try to draw a box on the license plate part.
Okay, let’s get started.
we will use the Wpod-net(Warped Planar Object Detection Network) model.
What is Wpod-net
License plates are intrinsically rectangular and planar objects, which are attached to vehicles for identification purposes. To take advantage of its shape, proposed a novel CNN called Warped Planar Object Detection Network. This network learns to detect LPs in a variety of different distortions and regresses coefficients of an affine transformation that “unwarps” the distorted LP into a rectangular shape resembling a frontal view. Although a planar perspective projection could be learned instead of the affine transform, the division involved in the perspective transformation might generate small values in the denominator, and hence leading to numerical instabilities.
The WPOD-NET was developed using insights from YOLO, SSD, and Spatial Transformer Networks (STN). YOLO and SSD perform fast multiple object detection and recognition at once, but they do not take spatial transformations into account, generating only rectangular bounding boxes for every detection. On the opposite, STN can be used for detecting non-rectangular regions, however, it cannot handle multiple transformations at the same time, performing only a single spatial transformation over the entire input.
The detection process using WPOD-NET is illustrated in Fig. Initially, the network is fed by the resized output of the vehicle detection module. The feedforwarding results in an 8-channel feature map that encodes object/non-object probabilities and affine transformation parameters. To extract the warped LP, let us first consider an imaginary square of fixed size around the center of a cell (m, n). If the object probability for this cell is above a given detection threshold, part of the regressed parameters is used to build an affine matrix that transforms the fictional square into an LP region. Thus, they can easily unwrap the LP into a horizontally and vertically aligned object.
Training Details
For training the proposed WPOD-NET, they created a dataset with 196 images, being 105 from the Cars Dataset, 40 from the SSIG Dataset (training subset), and 51 from the AOLP dataset (LE subset). For each image, they manually annotated the 4 corners of the LP in the picture (sometimes more than one). The selected images from the Cars Dataset include mostly European LPs, but there are many from the USA as well as other LP types. Images from SSIG and AOLP contain Brazilian and Taiwanese LPs, respectively. A few annotated samples are shown in Fig.
Given the reduced number of annotated images in the training dataset, the use of data augmentation is crucial. The following augmentation transforms are used:
— Rectification: the entire image is rectified based on the LP annotation, assuming that the LP lies on a plane;
— Aspect-ratio: the LP aspect-ratio is randomly set in the interval [2, 4] to accommodate sizes from different regions;
— Centering: the LP center becomes the image center;
— Scaling: the LP is scaled so its width matches a value between 40px and 208px (set experimentally based on the readability of the LPs). This range is used to define the value of α used in Eq. Amn(p) = 1/α ( (1/Ns) p − [n/ m])
— Rotation: a 3D rotation with randomly chosen angles is performed, to account for a wide range of camera setups;
— Mirroring: 50% chance; — Translation: random translation to move the LP from the center of the image, limited to a square of 208 × 208 pixels around the center;
— Cropping: considering the LP center before the translation, crop 208 × 208 regions around it;
— Colorspace: slight modifications in the HSV colorspace;
— Annotation: the locations of the four-LP corners are adjusted by applying the same spatial transformations used to augment the input image.
From the chosen set of transformations mentioned above, a great variety of augmented test images with very distinct visual characteristics can be obtained from a single manually labeled sample. For example, Fig. 6 shows 20 different augmentation samples obtained from the same image.
the network trained with 100k iterations of mini-batches of size 32 using the ADAM optimizer [15]. The learning rate was set to 0.001 with parameters β1 = 0.9 and β2 = 0.999. The mini-batches were generated by randomly choosing and augmenting samples from the training set, resulting in new input tensors of size 32 × 208 × 208 × 3 at every iteration.
I have pre-trained Wpod-net you can download it from my GitHub
First of all, you can clone my Github repository to get the source code, dataset, and pre-trained model.
$ git clone https://github.com/sameerbairwa/ANPR
Next, open a new notebook and import all the required libraries and packages. Brief descriptions and function of them are illustrated below:
- cv2: Computer Vision library, also known as OpenCV, which will use to perform image processing techniques.
- NumPy: A library that supports multi-dimensional arrays and matrices operation.
- matplotlib: A library supports the plot and visualizes our data.
- local_utils: A python script includes some functions which will be used to process data from Wpod-Net.
- os.path / glob: Operating system interface package/library for python. We will use them to deal with directories and file systems.
- keras.models: We will use package model_from_json from this library to load our model architecture in JSON format.
import cv2
import numpy as np
import matplotlib.pyplot as plt
from local_utils import detect_lp
from os.path import splitext,basename
from keras.models import model_from_json
import glob
There is a local_utils file in the GitHub repo, you need to download it also.
it contain detect_lp function.
after import, all required libraries create a load_model function so that we can successfully load our wpod-net.
def load_model(path):
try:
path = splitext(path)[0]
with open('%s.json' % path, 'r') as json_file:
model_json = json_file.read()
model = model_from_json(model_json, custom_objects={})
model.load_weights('%s.h5' % path)
print("Loading model successfully...")
return model
except Exception as e:
print(e)wpod_net_path = "wpod-net.json"
wpod_net = load_model(wpod_net_path)
Subsequently, we need to create a function name preprocess_image to read and pre-process our plate images. This function basically reads the parsing image (line 2), converts it to RGB (line 3), and normalizes the image data to 0–1 range (line 4) so it can be compatible with matplotlib. Additionally, we can set resize = True to resize all images to same dimension of (width = 224, height = 224) for visualizing purpose in the next step.
Now create get_plate function that returns us a plate’s image.
# forward image through model and return plate's image and coordinates
# if error "No Licensese plate is founded!" pop up, try to adjust Dmin
def get_plate(image_path, Dmax=608, Dmin=256):
vehicle = preprocess_image(image_path)
ratio = float(max(vehicle.shape[:2])) / min(vehicle.shape[:2])
side = int(ratio * Dmin)
bound_dim = min(side, Dmax)
_ , LpImg, _, cor = detect_lp(wpod_net, vehicle, bound_dim, lp_threshold=0.5)
return LpImg, cor# Obtain plate image and its coordinates from an image
test_image = image_paths[17]
LpImg,cor = get_plate(test_image)
print("Detect %i plate(s) in"%len(LpImg),splitext(basename(test_image))[0])
print("Coordinate of plate(s) in image: n", cor)# Visualize our result
plt.figure(figsize=(12,5))
plt.subplot(1,2,1)
plt.axis(False)
plt.imshow(preprocess_image(test_image))
plt.subplot(1,2,2)
plt.axis(False)
plt.imshow(LpImg[0])plt.savefig("part1_result.jpg",dpi=300)
so we get the license plate from the image, now let’s create a function that draws a box over the license plate.
In the next article, we will do the license plate character segmentation.
If you like this article please do clap, it will encourage me to write good articles.
Don’t forget to give us yours 👏 !