- Pearson’s Correlation is the Feature Selection Method.
- It shows direction and strength between dependant and independent variables.
- This method best suited when there is a linear relation between dependant and Independent.
- Its value ranges from -1 to 1.
- -1 means there is strong -ve relation between dependant and independent.
- 0 means there is no relation between dependant and independent at all.
- 1 means there is strong +ve relation between dependant and independent.
- variance measures the variation of data from its mean.
- Standard Deviation is a square root of variance.
- Covariance measures the linear relationship between variables.
# importing librariesimport numpy as np
import pandas as pd
import matplotlib.pyplot as plt
import seaborn as sns
%matplotlib inline
- we say that there is strong +ve relation between dependant and independent variables.
- we say that there is no relation at all between dependant and independent variables.
- we say that there is strong -ve relation between dependant and independent variables.
- we are creating some raw data to understand the relation between the two.
- we are also going to plot linear graphs for better understanding.
X1 = [1,2,3,4,5]
y1 = [1,2,3,4,5]X2 = [1,2,3,4,5]
y2 = [1,1,1,1,1]
X3 = [5,4,3,2,1]
y3 = [1,2,3,4,5]
Now, visualize the above data
plt.figure(figsize=(15,5))
plt.subplot(1,3,1)
plt.plot(X1, y1)
plt.title('Fig: 1.1 nincreasing X, y increasing ')
plt.xlabel('+ ve correlation')
plt.ylabel('increasing value of y')plt.subplot(1,3,2)
plt.plot(X2, y2)
plt.title('Fig: 1.2 nincreasing X, y constant ')
plt.xlabel('no correlation')
plt.ylabel('constant value of y')
plt.subplot(1,3,3)
plt.plot(X3, y3)
plt.title('Fig: 1.3, ndecreasing X, y increasing ')
plt.xlabel('-ve correlation')
plt.ylabel('increasing value of y')
plt.show()
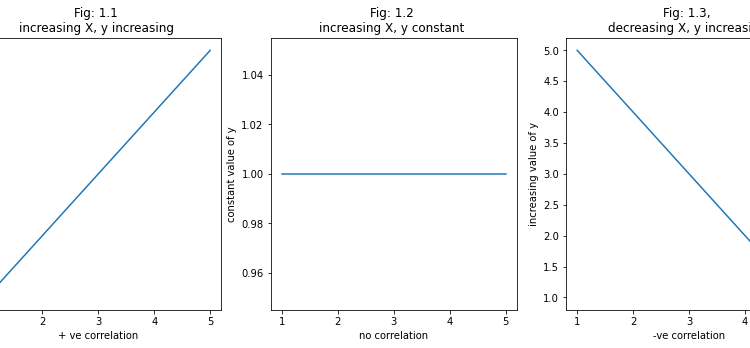
- In fig 1.1, we can observe that if the value of X is increasing the value of y is also increasing it means that there strong +ve correlation between these two.
- In fig 1.2, we can observe that if the value of X is increasing the value of y is constant it means that there no correlation at all.
- In fig 1.3, we can observe that if the value of X is decreasing the value of y is increasing it means that there a strong -ve correlation between these two.
Now, It’s time for applying Pearson’s Correlation.
# import dataset
# here we are using housing dataset.train_data = pd.read_csv('/content/drive/MyDrive/My Datasets/House Price/train.csv')train_data.shapeoutput:(1460, 81)
- Here, we are not doing any kind of feature engineering, so we are selecting only integer columns and dropping rows that have null values just for applying Pearson’s correlation.
# getting only integer columns.train_data.drop(train_data.select_dtypes(include='object').columns, inplace=True, axis=1)
# dropping columns which have missing value percentage greater than 60train_data.drop(train_data.columns[train_data.isnull().mean()>0.60], inplace=True, axis=1)
output:(1460, 38)
train_data.shape
- This heatmap shows how many null values are present in the dataset.
plt.figure(figsize=(20, 7))
sns.heatmap(train_data.isnull(), yticklabels=False, cbar=False)
plt.show()
# dropping rows which have missing values.train_data.dropna(inplace=True, axis=0)train_data.shapeoutput:(1121, 38)plt.figure(figsize=(20, 7))
sns.heatmap(train_data.isnull(), yticklabels=False, cbar=False)
plt.show()
- we have cleaned our dataset till now. Time to use Pearson’s correlation.
from sklearn.feature_selection import f_regression, SelectKBest# f_regression method used for pearson's correlation.
# SelectKBest method used to select top k best features.
- Assigning dependent variables to variable X and.
- Assigning an independent variable to variable y.
X = train_data.drop(['SalePrice'], axis=1)
y = train_data['SalePrice']
- here creating an object for SelectKBest using the f_regression score function.
skb = SelectKBest(score_func=f_regression, k=10)
- Now, we are fitting our model using variables X and y.
# fit meathod used to fit model on dataset using our score function.skb.fit(X, y)
- above code returns below output.
SelectKBest(k=10, score_func=<function f_regression at 0x7fded4e704d0>)
- get_support returns the boolean list of True and False values. we can use this list to get our columns from the dataset. when True it considers the column otherwise it does not consider a column t return.
# get_support() returns the boolean list of columns .col = skb.get_support()
output:array([False, False, False, False, True, False, True, True, False,
col
False, False, False, True, True, False, False, True, False,
False, True, False, False, False, True, False, False, True,
True, False, False, False, False, False, False, False, False,
False])
- get_support(indices=True) returns the list of integers which denotes the number of a particular column.
# get_support(indices=True) returns the list of k columns indices which have high pearson's correlations.col = skb.get_support(indices=True)
output:
col
array([ 4, 6, 7, 12, 13, 16, 19, 23, 26, 27])# scores_ returns correlation values of every feature.
skb.scores_output:array([2.49023403e+00, 8.73950826e+00, 1.50458329e+02, 1.10639690e+02,
1.96036658e+03, 1.75866077e+01, 4.26662160e+02, 4.17465247e+02,
3.51021787e+02, 2.01096191e+02, 8.79325850e-01, 5.32479989e+01,
6.82869769e+02, 6.56137887e+02, 1.16337572e+02, 2.45763523e-03,
1.10672093e+03, 6.64373624e+01, 1.49381397e+00, 5.29173583e+02,
8.69809362e+01, 3.20295557e+01, 2.25333340e+01, 4.77935018e+02,
3.03445055e+02, 3.82561158e+02, 8.05838393e+02, 6.96288859e+02,
1.43226582e+02, 1.49551920e+02, 2.74886917e+01, 1.06092031e+00,
1.38136215e+01, 9.65457023e+00, 1.45543888e+00, 2.98365208e+00,
1.57654584e-01])# this is our final dataset after using pearson's correlationX.iloc[:, col]
- Here is my complete notebook on Pearson’s Correlation. Click here
Summary:
- we have learned how to use Pearson’s Correlation and also how to implement using the Sklearn library.
- we have also seen how to use the SelectKBest method to select the K feature from a dataset.
