
Building a nonlinear classifier using SVMs

- An SVM provides a variety of options to build a nonlinear classifier. We need to build a nonlinear classifier using various kernels.
- When we want to represent a curvy boundary between two sets of points, we can either do this using a polynomial function or a radial basis function.
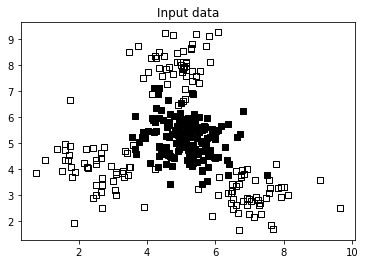
Dataset: download the file ‘data_multivar’ from https://github.com/appyavi/Dataset We will use a different kernel to deal with a markedly nonlinear problem.
Let’s see how to build a nonlinear classifier using SVMs:
- Let’s use a polynomial kernel to build a nonlinear classifier. The code is similar to linear svm; we replaced params = {‘kernel’: ‘linear’} used in svm linear with the following: params = {‘kernel’: ‘poly’, ‘degree’: 3}
import numpy as np
import matplotlib.pyplot as plt
import utilities
# Load input data
input_file = 'data_multivar.txt'
X, y = utilities.load_data(input_file)
###############################################
# Separate the data into classes based on 'y'
class_0 = np.array([X[i] for i in range(len(X)) if y[i]==0])
class_1 = np.array([X[i] for i in range(len(X)) if y[i]==1])
# Plot the input data
plt.figure()
plt.scatter(class_0[:,0], class_0[:,1], facecolors='black', edgecolors='black', marker='s')
plt.scatter(class_1[:,0], class_1[:,1], facecolors='None', edgecolors='black', marker='s')
plt.title('Input data')
plt.show()
###############################################
# Train test split and SVM training
from sklearn import model_selection
from sklearn.svm import SVC
X_train, X_test, y_train, y_test = model_selection.train_test_split(X, y, test_size=0.25, random_state=5)params = {'kernel': 'poly', 'degree': 3}classifier = SVC(**params, gamma='auto')
classifier.fit(X_train, y_train)
utilities.plot_classifier(classifier, X_train, y_train, 'Training dataset')
plt.show()###############################################
# Evaluate classifier performance
from sklearn.metrics import classification_report
target_names = ['Class-' + str(int(i)) for i in set(y)]
print("n" + "#"*30)
print("nClassifier performance on training datasetn")
print(classification_report(y_train, classifier.predict(X_train), target_names=target_names))
print("#"*30 + "n")plt.show()
The following images will be the output: