Here we are going to analyze the digits data-set of the Sci-Kit learn library. We are going to train a Support Vector Machine(SVM) and then we will be predicting the values of a Unknown Handwritten digits.
And then we will find the accuracy of the predictions made and based on that we will accept or reject the Hypothesis.
Note: The following implementation has been done in Google Colab
Step 1 : Importing the Modules
Step 2 : Loading the Digit Dataset of Sklearn
The Scikit-learn library provides numerous datasets, among which we will be using a data set of images called Digits. This data set consists of 1,797 images that are 8×8 pixels in size. Each image is a handwritten digit in grayscale.
The images of the handwritten digits are contained in a digits.images array. Each element of this array is an image that is represented by an 8×8 matrix of numerical values that correspond to a grayscale from white, with a value of 0, to black, with the value 15.
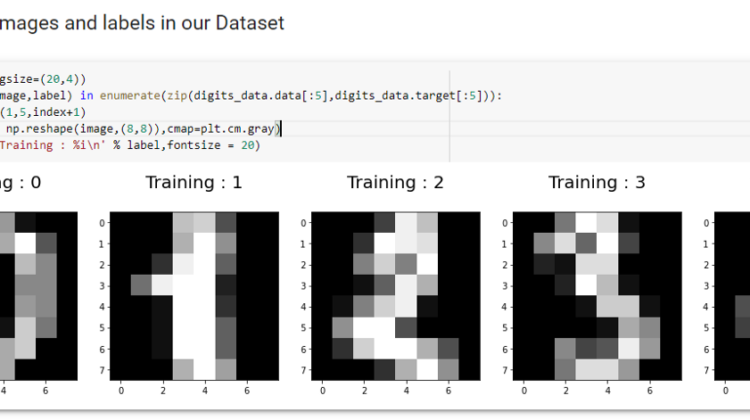
Step 3 : Visualizing the images and labels in our Dataset
We can obtain the gray-scale image using the matplotlib library.
Step 4 : Modelling the Classifier
An estimator that is useful in this case is sklearn.svm.SVC, which uses the technique of Support Vector Classification (SVC).
Import the svm module of the scikit-learn library,create an estimator of SVC type and then choose an initial setting, assigning the values C and gamma generic values. These values can then be adjusted in a different way during the course of the analysis.
As per the problem statement, we will train our SVM with the first 1790 images in out data-set. After that we will use the remaining Data-set as our test data and check the accuracy of our training machine.
Step 5 : Comparing the predicted value and actual value for few digits
We infer that both the predicted values and actual values are same and is 100% accurate, for few digits.
Step 6 : Finding accuracy of the Model
Let us now define a function that will find the accuracy of our SVM and train our model with varying data-set. We will start with 3 elements in our training data and work our way up to 1790 data and store the accuracy of our models in a dictionary.
Step 6.1 : Defining a function
Step 6.2 : Dictionary to store the results
Now let us define a dictionary named value that contains the accuracy scores of our model for varying training image data sets .
Step 7 : Plotting the Dictionary — Values
Let us plot our dictionary “values” that has the accuracy results for varying image training data set.