- Hypothesis to be tested : The Digits data set of scikit-learn library provides numerous data-sets that are useful for testing many problems of data analysis and prediction of the results. Some Scientist claims that it predicts the digit accurately 95% of the times. Perform data Analysis to accept or reject this Hypothesis.
So, This article presents recognizing the handwritten digits (0 to 9) using the famous digits data set from Scikit-Learn, using a classifier called Logistic Regression.
So, Lets start
Step1: Import the useful Libraries.
Step2: Loading dataset.
The Scikit-learn library provides numerous datasets, among which we will be using a data set of images called Digits. This data set consists of 1,797 images that are 8×8 pixels in size. Each image is a handwritten digit in grayscale.
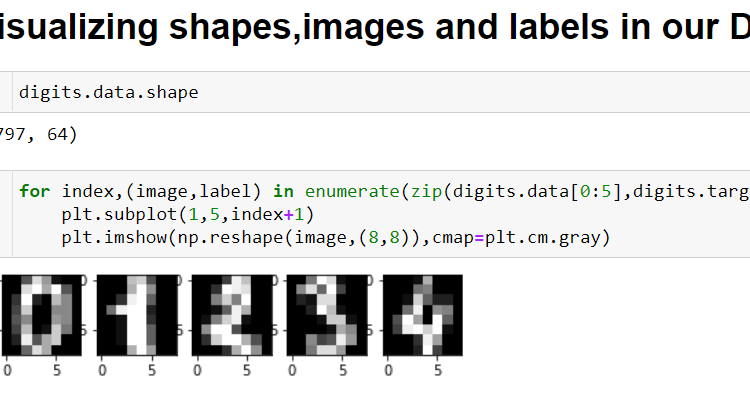
Step3: Visualizing Shapes, images and labels in our Dataset.
For visualizing Shapes , images and labels of our dataset we use following command. By using digits.data.shape we get to know that there are 1797 images in digits dataset.
Step4: Splitting our Dataset into training and testing sets.
Here, we are using 75% of data in datasets for training our model and rest 25% for testing our model.
Step5: Importing the model we want to use.
We will be using Logistic Regression for Recogninizing Handwritten Digits. Logistic regression is a linear classifier and therefore used when there is some sort of linear relationship between the data.
Here lr is used for instantiating LogisticRegression .And by using lr.fit(), Model is learning the relationship between digits (x_train) and labels (y_train). lr.predict() is predicting the labels of new data
Step6: Calculating Confusion Matrix.
A confusion matrix is a table that is often used to evaluate the accuracy of a classification model.. Here Accuracy=(Sum of left diagonal)/(Sum of both diagonal)
Step7: Measuring the performance of our Model.
To test the accuracy of our predictions we have use accuracy_score.
Result shows that we get 95.11% of the digits correct.
Now, we can say that NULL HYPOTHESIS(Scientist claims that it predicts the digit accurately 95% of the times) is true.
At last I would like to say that “I am thankful to mentors at https://internship.suvenconsultants.com for providing awesome problem statements and giving many of us a Coding Internship Exprience. Thank you www.suvenconsultants.com“