Use ML to make a content-based recommendation for new users.
To train an ML model we will use “transaction_data”.
- We want to predict the value column, given the demographic information.
- In this data, ‘person’, ‘event’, ‘time’, and ‘date’ column is not necessary.
- we will group the data by ‘person’ and try to predict the median value. Since a person can occasionally spend more or less than the usual amount, we are removing those outliers by taking the median.
Data Preprocessing:
How did I handle the NaN values? From the analysis so far, we know that there are some rows with no demographic information. These rows have age = 118, gender = Unknown and income = NaN.
Since we know, these NaN values are correlated with no information. So we can treat them as outliers, we can simply filter out the value and calculate the median expenditure and use that value if a new customer doesn’t provide any demographic data.
A look at the data:
X_data.head(10) # target variable>>>
gender       income       age
0       M       72000.0       33
1       O       57000.0       40
2       F       90000.0       59
3       F       60000.0       24
4       F       73000.0       26
5       F       65000.0       19
6       F       74000.0       55
7       M       99000.0       54
8       M       47000.0       56
9       M       91000.0       54
Here ‘gender’ is a categorical variable with F (female), M (male), O (other) categories. ‘income’ and ‘age’ are numerical data.
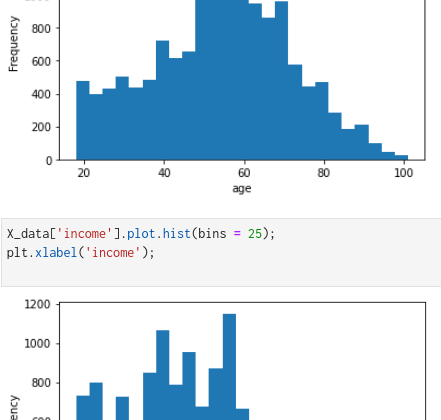
From the above plots of numerical columns, we see that the ‘age’ and ‘income’ columns are right-skewed. To make it gaussian, we will do a log transformation followed by standardizing the data to have a 0 mean value.
For the categorical column, ‘gender’ we will use a one-hot encoding.
I used scikit-learn pipeline to perform data preprocessing.
Since we had only three features, I used PolynomialFeatures from scikit-learn to add more features. Details on how this works can be found here.
For the target variable, I clipped the upper value to 25. Since, if a person spends more than $25, we won’t be sending any offers to them.
Train an ML model
Since this is a regression problem, we can use various regression methods to find the best model.
I used:
- Linear Regression
- Random Forest Regression
- SVM Regressor
- XGBoost regressor
After using these 4 methods, XGBoost gave me a better RMSE score, so I decided to use it as my final model.
xgb_reg.score(xtrain,ytrain)>>> 0.726548007942611xgb_reg.score(xtest,ytest)>>> 0.7019676940584976
Hyperparameter Tuning:
As a final step, we need to tune the hyperparameters to get the best parameter values.
I used scikit-learn’s RandomizedSearchCV to find the best parameter values.
Hyperparameters tuned for this problem is:
The best parameters are:
random_cv.best_estimator_>>> XGBRegressor(base_score=0.5, booster='gbtree',    colsample_bylevel=1,
colsample_bynode=1, colsample_bytree=1, gamma=0, gpu_id=-1,
importance_type='gain', interaction_constraints='',
learning_rate=0.2, max_delta_step=0, max_depth=3,
min_child_weight=3, missing=nan, monotone_constraints='()',
n_estimators=100, n_jobs=8, num_parallel_tree=1, random_state=0,
reg_alpha=0, reg_lambda=1, scale_pos_weight=1, subsample=1,
tree_method='exact', validate_parameters=1, verbosity=None)from sklearn.metrics import mean_squared_errormean_squared_error(ytest, random_cv.predict(xtest), squared=False)>>> 4.652565341873455
Finally, we can set a rule for sending out coupons to new users.
- A person with no demographic data is expected to spend $1.71, so we can send out an Informational offer or No offer!
- If a user is expected to spend < $3 or >$22, send out an Informational offer or No offer!
- If a user is expected to spend ≥ $3 and <$5, send out the $5 coupon offers.
- If a user is expected to spend ≥ $5 and < $7, send out the $7 coupon offer.
- If a user is expected to spend ≥ $7 and < $10, send out the $10 coupons.
- Lastly, If a user is expected to spend ≥$10 and < $20, send out the $20 coupon.
Example:
person_demo = {
'gender' : ['M','F','O'],
'income' : [60000.0,72000.0,80000.0],
'age' : [36,26,30]
}predict_expense(person_demo, final_model)>>> array([ 3.78, 10.66, 22.26], dtype=float32)
- Person 1: gender = Male, income = 60000.00, age = 36. Expected to spend $3.78, so send out a $5 coupon.
- Person 2: gender = Female, income = 72000.00, age = 26. Expected to spend $10.66, so send out a $20 coupon.
- Person 3: gender = Other, income = 80000.00, age = 30. Expected to spend $22.26, so send out a Informational coupon/no coupon at all!
In summary,
- I created a rank-based recommendation system to filter out top potential users who have a high chance of viewing and redeeming an existing or future offer.
- I used a user-user based collaborative filtering method to find out the top potential users specific to an offer.
- Finally, I used the Machine Learning approach to recommend offers to new users.
In the future,
- I am planning to deploy the model and build a data dashboard on the web.
- I will try to improve the model performance by performing more feature engineering.
The GitHub repository of this project can be found here.
