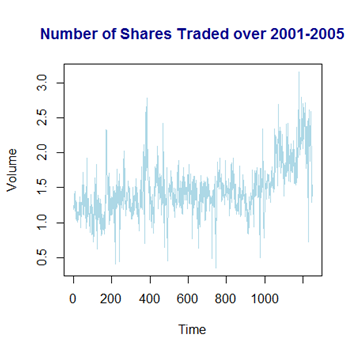
Stock Market Data consist of percentage return for the S&P 500 stock index over 1250 days (2001–2005). This data consists percentage return in 5 previous day and number of shares traded (in billions) on the previous day. Also there is information percentage return on every day over 2001–2005 and whether market was Up and Down based on the percentage return information. Then based on information of volume variable from data, number of shares traded over 2001–2005 tends to increase as show by the below graphic:
For this modeling to classify response of data, Stock Market Data divides to be 2 part that is data from 2001–2004 to be data training and for 2005 to be data test. Data training is used to estimate coefficient which use for qualitative prediction or classification model such as logistic regression. Also for qualitative prediction or classification response of data in this written are logistic regression, Linear Discriminant Analysis (LDA), Quadratic Discriminant Analysis (QDA) and K-Nearest Neighbors (KNN). Response of data is direction variable and this modeling in order to predict direction for a day is up or down based on the percentage return of the day. For other variable in the data is to be predictor variable. Those variables are percentage return in 5 previous days respectively and volume as number of shares traded.
A. Logistic Regression
Classification of direction of a day is determined of probability which is obtained from the below equation:
With p(X) is probability of the response, β_i for i=0,1,…,p coefficient estimate of logistic regression model and X_i for i=0,1,…,p predictor for the model.
In this written, if the probability p(X) is obtained close to zero or in the below of a threshold, then return percentage is predicted to be down. Also otherwise the probability is close to one or over of a threshold, the return percentage is predicted to be up.
The data is predicted with 2 predictors (Lag1 and Lag2) which give better result than use all predictors in model. Afterwards coefficient estimate of each of predictors are β_0= 0.032, β_1= -0.056 and β_2= -0.044.then the equation of logistic regression as follow:
For instance using the above logistic regression in order to predict return percentage of a day which have return percentage for 2 days before the day successive are Lag1= -0.812 and Lag2 = -0.134,then probability is obtained p(X) = 0.521. From this probability, so the return percentage of the day is predicted to be up with threshold 0.5.
Next the below table is confusion matrix that show amount of predicted value from data test and the resulting test error rate is 44%:
Based on confusion matrix, amount days to be predicted that return percentage up are 70 days, but there is 111 days that the return percentage up in the data test. Also with the amount days of return percentage down are predicted 182 days, but in the data test are 141 days.
B. Linear Discriminant Analysis (LDA)
As like as logistic regression method, LDA method is applied to data training for predict return percentage in data test with 2 predictors (Lag1 and Lag2). Then the equation is using in LDA method as follow:
K is sum of class of response for this modeling. Class 0 is for down class and class 1 is up class. With π_k is prior probability for each class and μ_k is mean of sample or data training for each class as well. Then ∑ is variance matrix and assumption for the matrix variance for this LDA model is same between of class. The last δ_k (x) is value of probability which uses for classify response into a class.
LDA model is applied for training to obtain confusion matrix as follow:
For this application of LDA model for the data training obtains error test rate of 44 %.
C. Quadratic Dicriminat Analysis (QDA)
Similarly with LDA method, equation that using in QDA as follow:
However for the above equation, assumption of covariance matrix is different each other. Also the equation of QDA method obtains confusion matrix as follow:
Error test rate is resulted 40% which better than logistic regression model and LDA model for this modeling. So QDA model is good enough to predict or classify Stock Market Data based on the value of error test rate.
D. K-Nearest Neighbors (KNN)
Last model for classify response of the data is K-Nearest Neighbors (KNN). For KNN, classifying response is based on closest neighbors which around data that will be classified. Also K of this model means sum of closest neighbors as reference to classify data.
Afterwards for this modeling, Sum of neighbors is selected 3 or k=3. Then application of KNN model with k=3 for the data training obtains confusion matrix as follow:
Error test rate is resulted 47% which is highest error test rate than all of previous models. So KNN model with k=3 is not good to apply for Stock Market Data in order to classify the data. Otherwise QDA model results lowest error test rate, so QDA is good enough for the data. But so many possible other model give error test rate better than 4 models in this written. Also to find the other model, it can be done with developing these 4 models.
An Introduction to Statistic Learning with Application in R ebook (Gareth James, Daniela Witten,Trevor Hastie,Robert Tibshirani)