Toeplitz Inverse Covariance-Based Clustering of Multivariate Time Series Data
Many applications ranging from cars to financial markets to wearable sensors
generate large amounts of time-series data these datasets can often be broken
down into a sequence of States for example raw sensor data from a fitness
tracking device can be interpreted as a temporal sequence of actions walking for 10 minutes then running for 30 minutes then sitting for one hour then running again for 45 minutes or using car data the driving session can be expressed as a sequential timeline of a few key states turning speeding up slowing down stopping at a red link going straight and so on learning these sequences can help us draw interpretable conclusions from the data however in general these states are not predefined and we do not know what they are or what they refer to therefore we need to learn both the states themselves and also how the time series splits into these states however achieving both goals simultaneously.
Many important problems can be modeled as a system of interconnected entities, where each entity is recording time-dependent observations or measurements. In order to spot trends, detect anomalies, and interpret the temporal dynamics of such data, it is essential to understand the relationships between the different entities and how these relationships evolve over time.
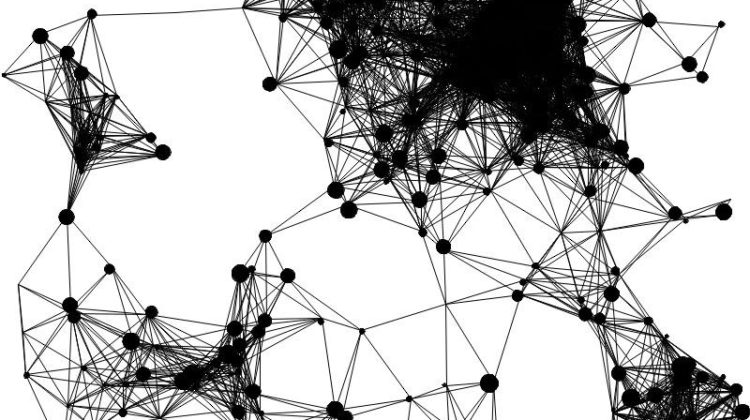
Graphical Models-
An undirected graph, each vertex represents a random variable. The absence of an edge between two vertices means the corresponding random variables are conditionally independent, given other variables. The Gaussian distribution is widely used for such graphical models, because of its convenient analytical properties. Penalized regression methods for inducing sparsity in the precision matrix are central to the construction of Gaussian graphical models.