Titanic Survival Prediction
This is the legendary Titanic ML competition — the best, first challenge for you to dive into ML competitions and familiarize yourself with how the Kaggle platform works.
The competition is simple: use machine learning to create a model that predicts which passengers survived the Titanic shipwreck.
The sinking of the Titanic is one of the most infamous shipwrecks in history.
On April 15, 1912, during her maiden voyage, the widely considered “unsinkable” RMS Titanic sank after colliding with an iceberg. Unfortunately, there weren’t enough lifeboats for everyone onboard, resulting in the death of 1502 out of 2224 passengers and crew.
While there was some element of luck involved in surviving, it seems some groups of people were more likely to survive than others.
In this challenge, we ask you to build a predictive model that answers the question: “what sorts of people were more likely to survive?” using passenger data (ie name, age, gender, socio-economic class, etc).
Dataset
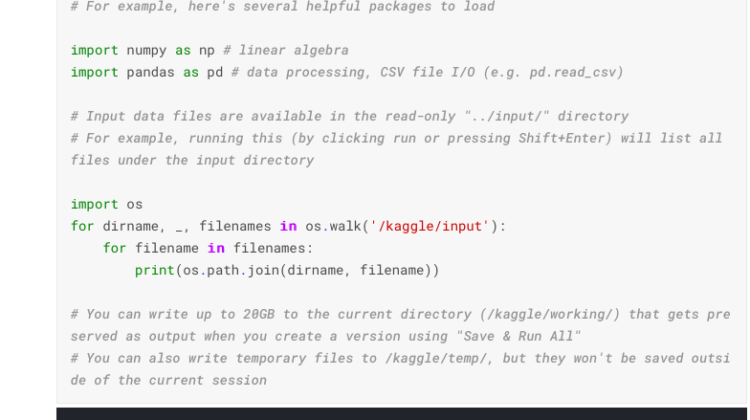
Lets see what are the data files given. Also lets import libraries like numpy, pandas.
from the above output we can see there are “train.csv”, “test.csv” & “gender_submission.csv” .
Next step is, let’s load & see 5 rows of train & test data.
Our train & test data is successfully loaded in variable train_data & test_data. we can see 5 rows of datas.
See, our goal is to find a pattern in “train_data” which will help us to predict wheather the passenger is survived in “test_data”.
If we will see the “gender_submission.csv” file, we will find that it assumes all the female passengers survived. let’s see if this is a reasonable guess.
From above 2 screen shots output , we can see that ~75% women survived whereas only ~19% Male survived. this prediction is not bad though.
But we see this prediction is based on only single column. So we can consider multiple columns, we may find a complex patterns.
So, to consider multiple columns simultaneously, its will take a lot of time to find complex patterns.
But we can automate this by creating a Machine Learning model to do the job for us.
Creating a Machine Learning Model
Let’s build a Random Forest Model. Random Forest consists of several decision trees & returns the most voted output.
Now lets consider feature [“Class”, “Sex”, “SibSp”, “Parch”]. & import “RandomForestClassifier” from sklearn. create a random forest tree with 100 trees.
Since we want to predict “Survived”, extract this & name it as y. also Let’s extract the features from train_data & test_data and call them X , X_test. after that create model & train it on y & X. then predict the on X_test.
At last, let’s save these new predictions in a CSV file my_submission.csv.
The Public score at Kaggle platform is 0.77511. Here is the kaggle notebook for reference.
I hope you liked this Article. Thanks for reading.
