To dive deeper…
I. Topic visualization can be done through distance maps and histogram plots, using pyLDAvis.
II. The most representative document for each topic can be found out.
III. Topic distribution across documents can also be computed.
IV. A function to calculate varying coherence scores with different argument values to the LDAmodel function may also be implemented.
Word Clouds may be used to capture a bird’s-eye view of the topic.
Here’s a link that discusses the implementation of LDA in more detail.
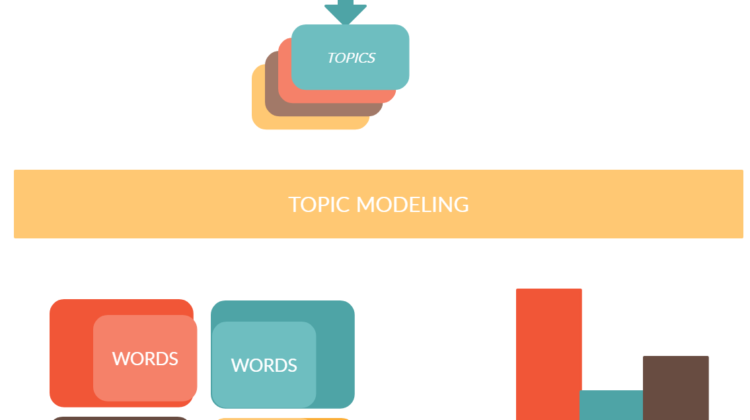
Words are not directly grouped into topics, rather a probability of the word belonging to the topic is calculated.
The topic giving the highest probability will be associated with the word.
The choice for the number of topics is subject to a set of often uncorrelated factors like human judgment, perplexity, coherence scores, etc.
For further analysis, we may also extract the most dominant topic in a given document, reduce the dimensionality of the corpus, etc.
To explore the applications of topic modeling, click here
I would also like to share with you all a very interesting read on Topic Modeling by Ted Underwood, University of Illinois.
To conclude, LDA being a probabilistic technique, is the way to go for finding interesting patterns in a large collection of data! Furthermore, data visualization libraries offer promising ways to represent features and insights from data.