Nowadays, detecting anomaly instances in time series data is becoming a very important task. This is particularly true in the case of critical applications such as fraud detection and financial trading systems. In this article, I will present a framework that is using supervised and unsupervised methods to detect anomaly data points in time series data. In addition, I will show how we can use the model interpretability tool called InterpretML to explain our classification model. As a use case, I will implement the framework to detect the anomaly data points in the financial data taken from the Tesla Stock Price (the dataset is published on Kaggle).
Anomaly detection can be classified as either points-based or patterns-based. Here, we will be focusing on points-based anomaly detection.
The framework consists mainly of three components: 1. Anomaly Detection and Checking, 2. Anomaly Classification, and 3. Model Interpretability
- Anomaly Detection and Checking
Below we first import data from CSV file that represents the Tesla Stock Price. The data does not contain any NaN value, it is not common in real-life applications though.
Let’s first check the skewness of our data. In pandas, there is a built-in function that can be applied to the data frames i.e., skew().
Given the output of the skew() function is x, then if -0.5 < x < 0.5, we say the data is symmetrical. If 0.5 < x < 1 or -1 < x < -0.5, then we say the data is moderately skewed. Finally, if x < -1 or x >1, we say the data is extremely skewed. Based on the skew values, Volume does is extremely skewed which indicates that there are potentially some or many anomaly values. Nevertheless, we cannot neglect the other dimensions such as ‘Open’, ‘High’, even though, the data does not seem to be skewed for those dimensions. The goal of this basic analysis is just to give some intuition about the skewness of our data.
Please, also note that usually we do more intensive descriptive analysis on our data for understanding. Intensive descriptive analysis is beyond the scope of this article.
Isolation Forest as an anomaly detection method:
In order to detect the anomaly instances in the data, several unsupervised machine learning models such as DBSCAN and IsolateForest were proposed. Here, we will apply the Isolation Forest method. Isolation Forest is an ensembling and tree-based method. From its name, it is called Isolation Forest, so the algorithm aims to isolate the outliers from other values. This is done by building several decision trees (here comes the forest :)). In each tree, the number of features is randomly selected, and within each feature, we select randomly a value (split value) between the min and max values. For each tree, the isolation forest calculates the number of splits needed for an instance to be isolated. In the end, given all the trees, the average number of splits for each instance is taken. The smaller the average value, the higher the chance of an anomaly. For more details about the Isolation Forest, I kindly refer you to the original paper (link).
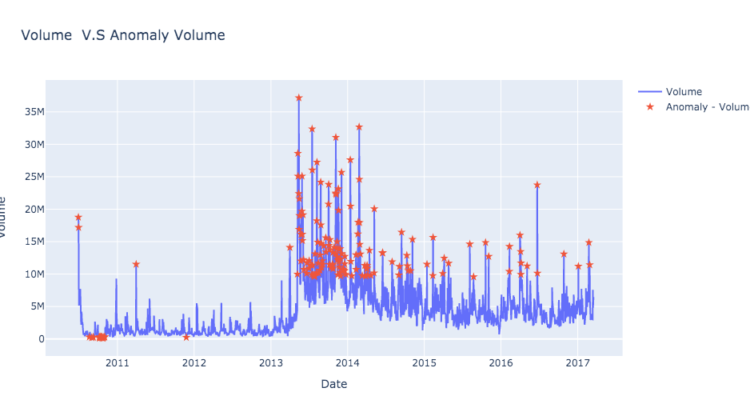
Below, as can be seen in the snapshot, we use IsolationForest to get the anomaly data points.
Please note that in line 13, I here change the anomaly indicator values from -1 to 1 to mark the data point as an anomaly and also change the value of non-anomaly data from 1 to 0, since this will be more intuitive to be used later on to train a classification model. It is worth mentioning that we use volume as a feature of the model. The volume has been selected since it showed already a high level of skewness in the analysis we did before. Other, some or all features (Close, Open, High, Low) can be used by IsolationForest as well.
2. Anomaly Classification
In the previous section, we show how we can apply Isolate Forest to identify the anomaly instances. Here, we will use the output of the Isolate Forest as input to build a classification model.
One may argue, what is the need for the classification model if the anomaly instances are already detected by the Isolate Forest?. First, Isolate Forest output needs to be checked by domain experts to verify and the results and filter out the false positive ones. Second, we need to build a classification that will take those verified results by the domain experts and use them to predict any coming instance in the future. In other words, experts will keep feeding our training dataset with high-quality instances that will use to train the classification model to predict instances accurately and precisely in the future. The more data we have, the better the performance of the model.
Nevertheless, for simplicity, we will assume that all instances generated by Isolate Forest are already checked and we will use them for training our classification model. Below is the code snippet we are using Explainable Boosting Machine (EBM). According to the authors: “EBM is a glassbox model, designed to have accuracy comparable to state-of-the-art machine learning methods like Random Forest and Boosted Trees, while being highly intelligibile and explainable.”. More details can be found in the original paper here in section 3. Note that you can also use directly sklearn classification models and explain them via blackbox explainers.
Below, we see that the performance of our classifier is good since the value of ROC-AUC is ~0.99. In practice, more measurements can be taken into accounts such as precision and recall but that depends on the application. In addition, we need to check that our models don’t underfit/overfit. However, those aspects are beyond the scope of this article.
You can also see that we use five features instead of only feature i.e, Volume. The reason is that, we used the Volume in the first place to detect the Volume anomalies but here we want feed to the model as much features as possibile such that the model can make better decision.
3. Model Interpretability
Below is the code snippet, where we use InterpretML framework to explain our EBM classification model.
As seen below Volume has the most influnce and it is the most feature important feature. In fact, this is expected since we use only this feature to detect anomalies using IsolationForest.
In the snapshot below, we see how Volum can influnce the decision of our classifier. When the score value is high that means that there is a high probability that the instance is anomaly (class = 1).
There are several explainers that you can explore and the documentation and examples can be found on InterpretML website.
In this article, I presented a framework for detecting anomaly data points. I show how we can use unsuperived and supervised methods to detect the anomaly instances in the time serise data. I used isolation forest to detect the anomaly data points that I used later on as training dataset for EBM classification model. In addition, I used InterpretML tool to explain and debug our classification model.
Rami Al-Salman