OK, so you get yourself going. Put a CSV file with data in a bucket, create an Autopilot Experiment from SageMaker Studio via the AWS Console, and choose the required Target column which you would like predictions for:
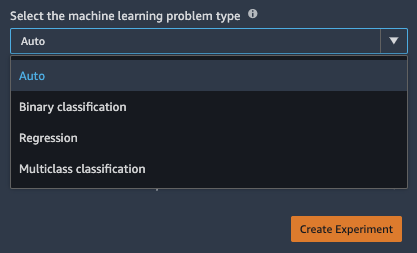
First issue you will very likely run into is just below. The default option for the type of training can take four values. Auto, Binary classification, Regression and Multiclass classification.
If you’re like me, you are tempted to try the defaults first to see how well Auto works. When your target column has numerical values (hundreds of distinct ones, to be clear) you would think Autopilot would make an educated best guess of Regression, right? Wrong. Attempt 1 failed: “It is unclear whether the problem type should be MulticlassClassification or Regression.”
Ah well, humans are still necessary, it seems. Forcing it to Regression, the only sensible choice in my case, and it gets started correctly. 250 models and hyperparameter evaluations later (1–2 hours of runtime; I went for lunch), I got myself some results. The results are ranked by lowest mean square error (under “Objective: Mse” in the console), and this is against the validation set which Autopilot conveniently automatically selects as a subset of the full input data.
I wanted to batch predict a couple of examples, not launch a live endpoint — although I tried that too and it worked great. If setting up an endpoint, it’s possible to batch predict from the console, and that also worked fine. But I wanted to batch predict using the resulting models from a Jupyter notebook, and this proved to be the most time-consuming part for me to figure out.
The winning job from my experiment ended up using two models chained together: Scikit-learn for feature engineering (preprocessing of the input columns), and XGBoost for the actual prediction of the numerical result. I found the model references in the winning trial details, stored as two model.tar.gz files in my bucket. My test data had 14 input columns and 1 target column for a total of 15 columns in my training file. Although I understood that the preprocessing resulted in a larger number of columns than the raw input, I had quite a bit of trouble of finding out exactly how to define the pipeline model in my notebook.
Let me just say that if you are getting this:
[2020-12-11:10:27:18:ERROR] Loading csv data failed with Exception, please ensure data is in csv format:
<class 'ValueError'>
could not convert string to float: 'VID1234567101'
…even though your data is actually very much CSV, and very much the same type of data you provided as training, you are probably missing the preprocessing step. And if you get this:
[2020-12-11:10:37:12:ERROR] Feature size of csv inference data 14 is not consistent with feature size of trained model 1117.
…you have probably also missed the preprocessing step, but at least the data types happened to match. (My preprocessing model created 1117 features from 14 actual inputs; your feature count will obviously vary. I had some classification in my input which probably got expanded via one-hot encoding, and that was possibly not ideal, but I digress.)
I’ll spare you more details from my failed attempts — here’s the notebook that finally produced the predictions I wanted:
Useful to note is that the Docker image_uri references are in fact supposed to be to AWS account numbers depending on both the algorithm for your model and the region you run your notebook in. AWS has a reference list, but you can also retrieve them programmatically with sagemaker.image_uris.retrieve(…). Also notable is that you should omit the column you want to predict, which may seem obvious but is easy to forget if you are juggling around test files, and that you should not include any headers. Using the notebook above, the results are delivered as a single-column file in the output S3 bucket location.
